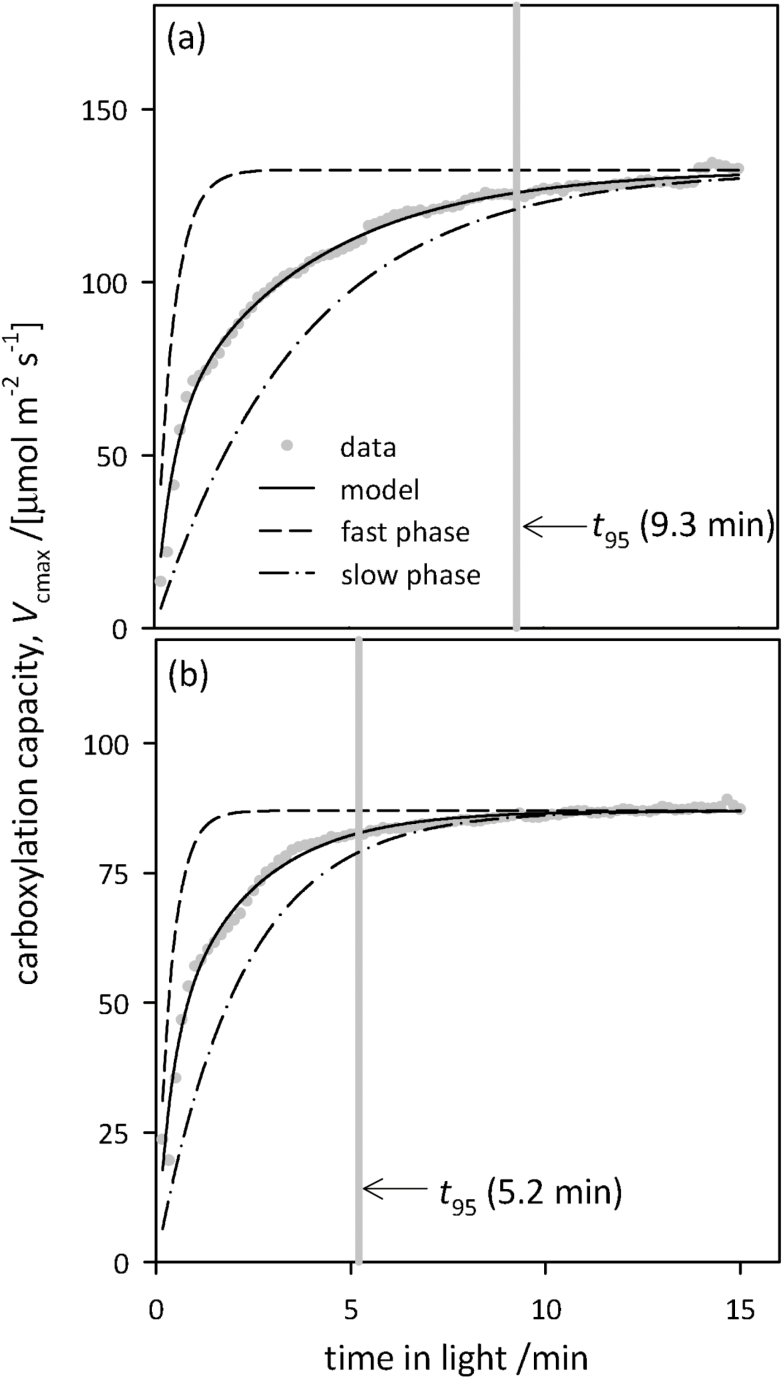
Fig. 3.
Representative time-courses of carboxylation capacity inferred from dynamic A versus ci curves measured on chamber-grown plants (Vcmax), for two leaves in which t95 (the time for Vcmax to rise through 95% of its dynamic range, shown with vertical gray bars) closely approximated the genotype median t95 for the slowest (a) and fastest (b) genotypes. The dashed and dash-dot lines represent the fast and slow phases of the model for Vcmax induction, respectively (each adjusted to the same asymptote as the full model), and the solid black line is the overall model. For (a), the fast-phase time constant (τfast) was 0.29 min, the slow-phase time constant (τslow) was 2.1 min, and the weighting factor for the fast phase (f) was 0.46; for (b), τfast=0.51 min, τslow=3.8 min, and f=0.42. Note the different y-axis ranges in (a) and (b).

