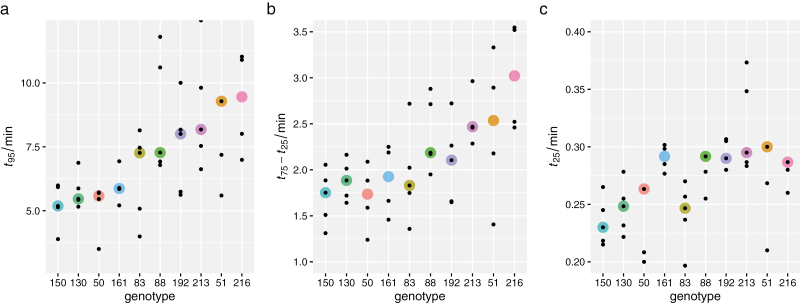
Fig. 4.
Distribution of values of the time for Vcmax to increase through (a) 95% of its dynamic range, t95, (b) the middle 50% of its dynamic range, t75–t25, and (c) 25% of its dynamic range, t25. Large colored circles are medians for each genotype; small symbols are individual data points. Several outlying points are omitted: in (a), two values for genotype #51, and in (c), two values for #88 and one each for #50, 51, and 216.

