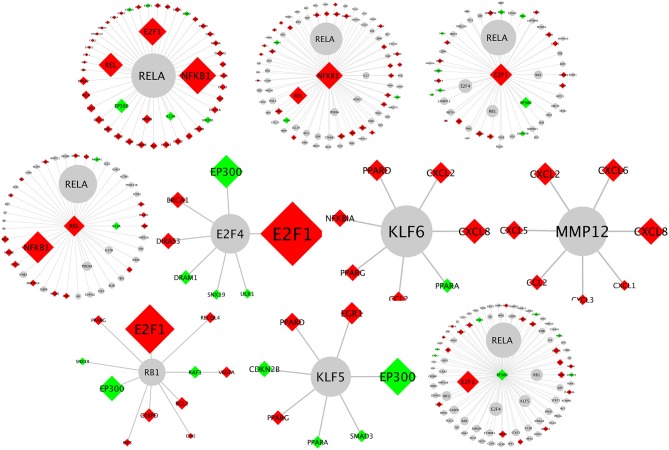
Figure 10.
Network schematics illustrating the first neighbor interactors of each of the contextual hub genes listed in Table 1. The contextual hub gene is at the center of each network diagram. Lines represent molecular interactions; red diamonds indicate upregulated transcripts; green diamonds indicate downregulated transcripts; and gray nodes are interactors that are not differentially expressed. Larger nodes correspond to more statistically significant hubs as calculated by the CHAT application.

