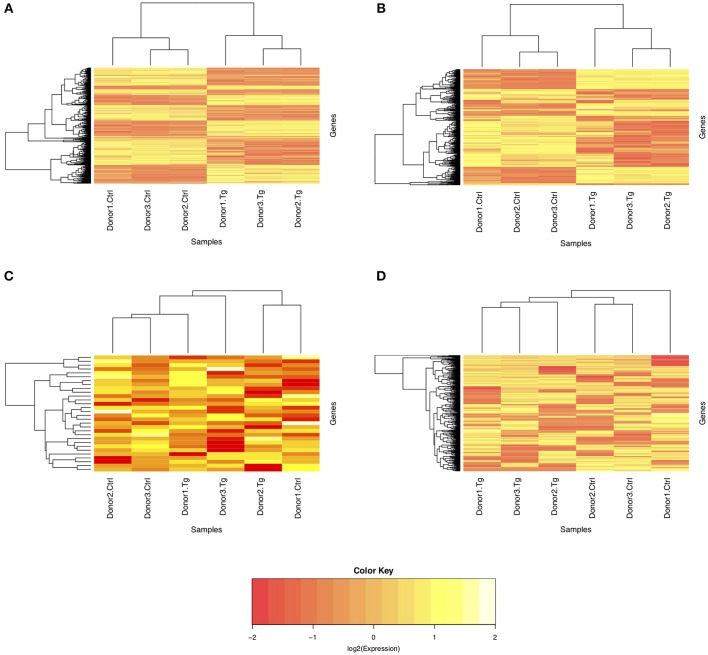
Figure 3.
Heat maps of normalized counts per million from sequencing of total and small RNA. Expression on the log2 scale is shown for (A) all differentially expressed genes from total RNA, (B) the 1,000 most variable genes from total RNA, (C) all differentially expressed genes from small RNA, and (D) the 1,000 most variable genes from small RNA. The color scale changes from yellow to red, with greater intensity yellow indicating higher counts for transcripts in either uninfected control or T. gondii-infected cells from three donors.

