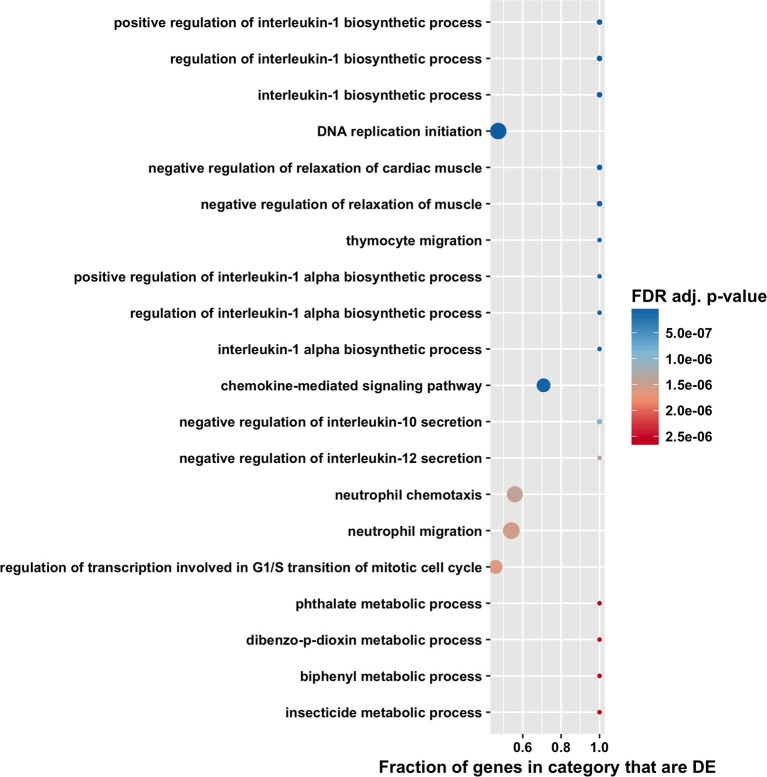
Figure 4.
Gene ontology biological process enrichment analysis by CAMERA of differential expression in total RNA. Dotplots show the 20 most significantly enriched gene ontology biological process. Point size corresponds to the size of the gene ontology category, and points are plotted horizontally by the fraction of genes in the category that are differentially expressed. The color scale changes from red to blue, with blue indicating lower (more significant) adjusted p-value for the category.

