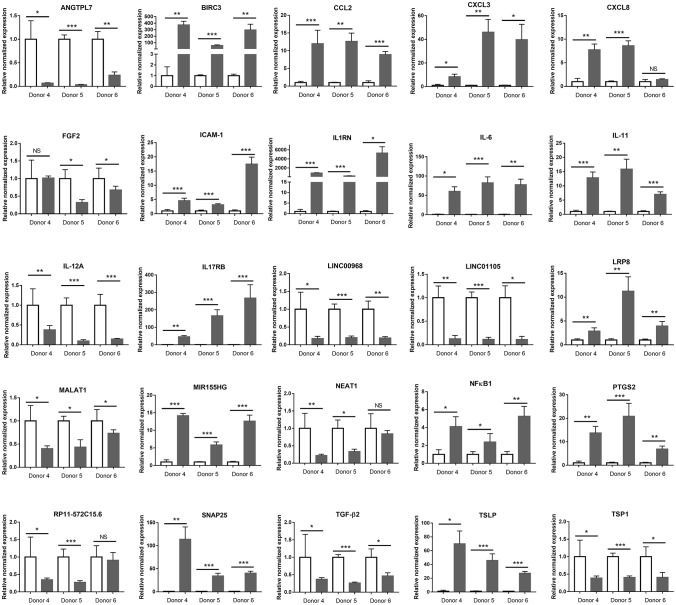
Figure 7.
Graphs showing relative transcript expression for selected immune response molecules in T. gondii-infected primary human retinal epithelial cells vs. uninfected cells. Reference genes were ribosomal protein lateral stalk subunit P0 (RPLP0) and peptidylprolyl isomerase A (PPIA). Open bars represent uninfected cells and solid bars indicate T. gondii-infected cells. Bars represent mean relative expression, with error bars showing standard error of the mean. n = 4 cultures/donor and condition. Data were analyzed by two-tailed Student's t-test. *p < 0.05, **p < 0.01; ***p < 0.001.

