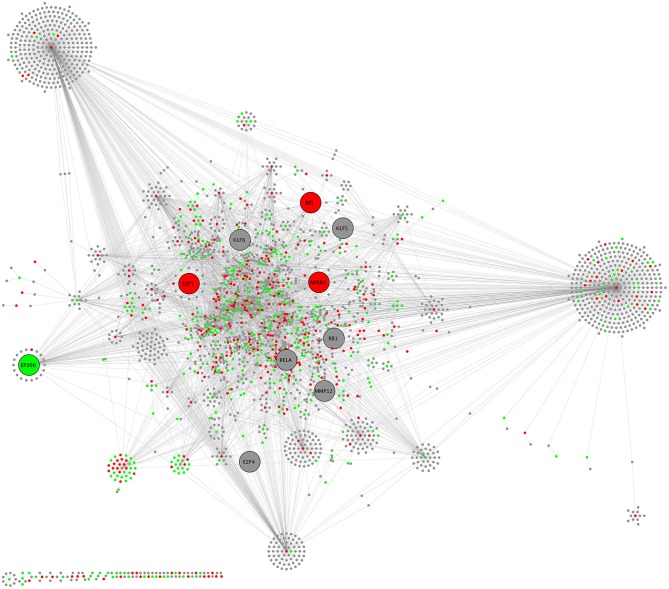
Figure 9.
CHAT network schematic of interactions between differentially expressed genes by sequencing of total RNA, as annotated in InnateDB. Lines represent molecular interactions; red nodes are upregulated transcripts; green nodes are downregulated transcripts; and gray nodes are first-neighbor interactors that are not differentially expressed. Large nodes indicate contextual hubs.

