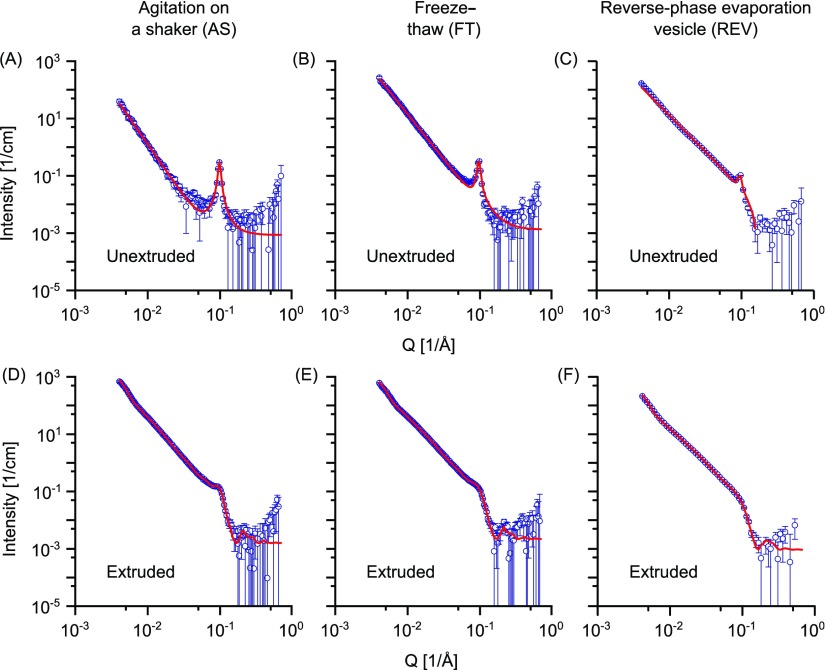
Figure 3.
SANS data of unextruded POPC vesicles prepared via the (A) AS method, (B) FT method, and (C) REV method, and POPC vesicles prepared via the (D) AS method, (E) FT method, and (F) REV method then extruded through a 100 nm membrane. Points with errors represent measured data and lines are fittings curves by a Broad Peak model (A,B) and models with uni-, bi-, tri- and quadrilamellar vesicle components (D–F). Data are plotted on a log–log scale.

