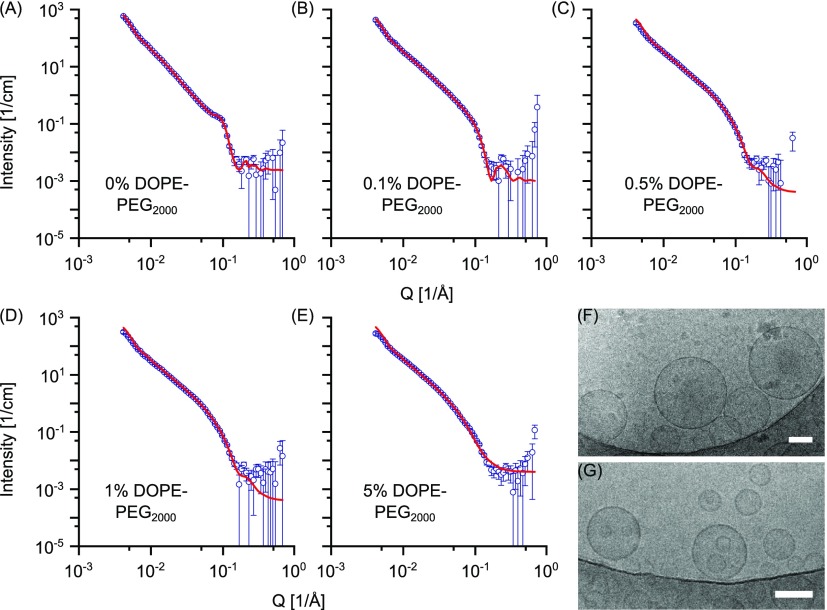
Figure 4.
SANS data of POPC vesicles prepared via the FT method and DOPE-PEG2000 at (A) 0, (B) 0.1, (C) 0.5, (D) 1, and (E) 5 mol %, respectively. Vesicles were extruded through 100 nm membrane 35 times. Points with errors represent measured data and lines are fittings curves by models with uni-, bi- and trilamellar vesicle components. Scattering data are plotted on a log–log scale. (F) Cryo-TEM of unextruded POPC vesicles containing 5 mol % DOPE-PEG2000. (G) Cryo-TEM of POPC vesicles containing 5 mol % DOPE-PEG2000 and extruded through a 100 nm membrane 35 times. In both cases, vesicles were prepared via the FT method. Scale bar: 100 nm.

