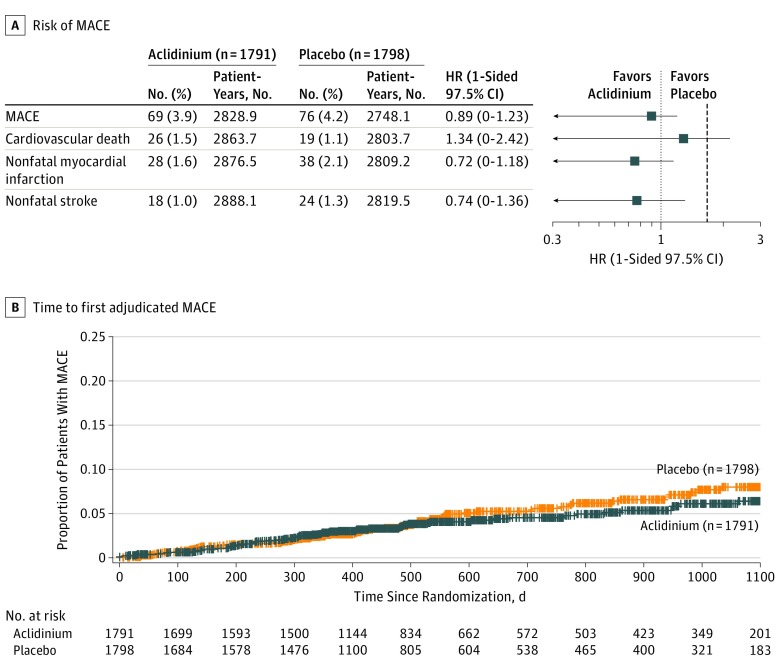
Figure 2. Risk of MACE and Time to First Adjudicated MACE (On-Study Analysis).
HR indicates hazard ratio; MACE, major adverse cardiovascular event. Estimates of HRs and 1-sided 97.5% CIs comparing aclidinium with placebo were derived using the Cox proportional hazard model with treatment group, baseline cardiovascular severity, and smoking status as factors. Observations were censored for Kaplan-Meier curve. An HR >1.0 indicates higher risk of MACE with aclidinium and an HR <1.0, lower risk of MACE with aclidinium. The vertical dashed line indicates the margin of noninferiority, 1.8. The median exposure time (including time after treatment discontinuation) was 495 days (interquartile range, 369-893 days) for aclidinium and 478 days (interquartile range, 357-869 days) for placebo.

