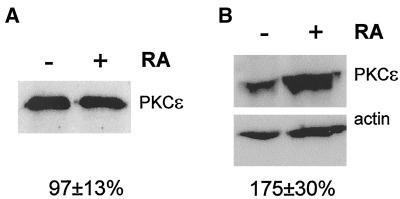
Figure 2.
Association of PKCε with the cytoskeleton during neuronal differentiation. SK-N-BE(2) cells were induced to differentiate with 10 μM RA for 4 d. (A) Total cell lysates, normalized for total protein content, were analyzed for PKCε immunoreactivity and band intensities were quantified. Data (mean ± SEM, n = 4) represent PKCε levels in differentiated cells in percentage of values obtained in control cell lysates. (B) Lysed cells were divided into a Triton X-100 soluble cytosolic/membrane and a particulate cytoskeletal fraction. Cytoskeletal fractions, normalized to the Triton X-100-soluble fractions for protein content, were subjected to Western blot analysis by using anti-PKCε (top) and anti-actin (bottom) antibodies. Data (mean ± SEM, n = 10) are PKCε/actin intensity ratios from differentiated cells in percentage of corresponding values obtained from control cells. The increase is statistically significant (p < 0.05) using Student's t test.

