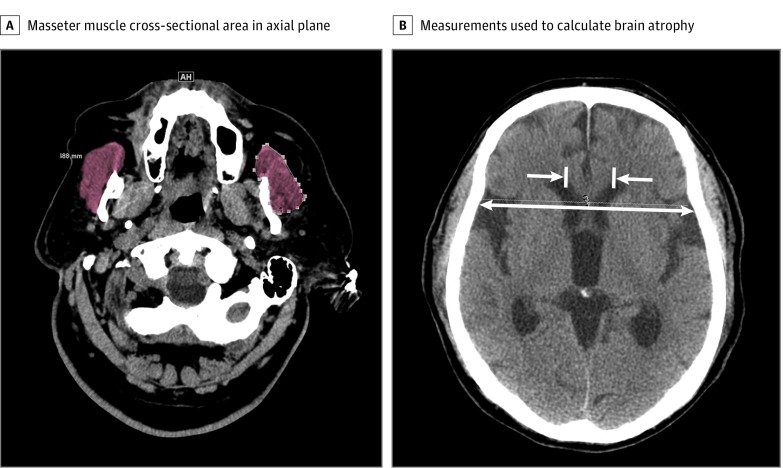
Figure 1. Example Masseter and Brain Atrophy Index Measurements.
A, Measurement of masseter muscle cross-sectional area in the axial plan, 2 cm below the inferior edge of the zygomatic arch. The masseter is highlighted in brown. B, Measurements taken to calculate brain atrophy index (intercaudate distance divided by interskull distance in the axial plane at the level of the fornix). The 2 medial-facing arrows show the caudate (intercaudate distance). The longer, double-arrow line shows the interskull distance, which is measured at the same coronal plane as the intercaudate distance.

