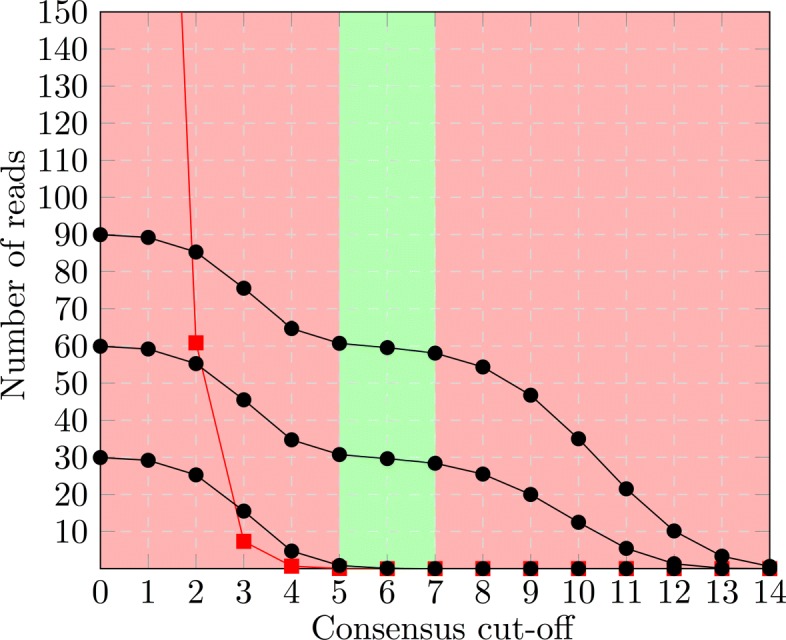
Fig. 2.

True positives and false positives for several Tis. If the groups Gj of a clique describe several Ti, the size of the consensus is determined by the aggregate of the true positives (black dots) from each Ti, as well as the false positives (red squares) from the remaining Tjs. The green area shows the cut-offs that create a consensus that accurately distinguishes one subset of s from the rest. It is exactly this range where the perfect or zero ranges of all Ti overlap. Furthermore, the aggregate number of true positives (denoted by the uppermost black dots) stays constant in this range
