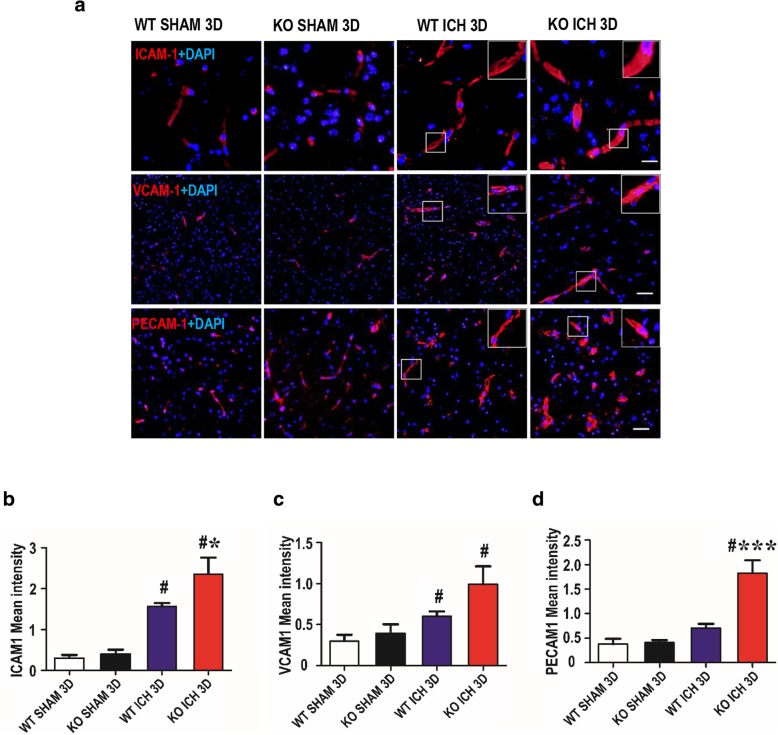
Fig. 6.
Deletion of TREK-1 promotes the ICAM-1, VCAM-1, and PECAM-1 protein expression after ICH. a Immunofluorescent staining of ICAM-1, VCAM-1, and PECAM-1 with DAPI in the perihematoma region on day 3 after ICH. Scale bar = 20 μm. b–d Semi-quantitative analysis of the mean immunofluorescent intensity of ICAM-1, VCAM-1, and PECAM-1. The data were represented as the mean ± SEM and evaluated by one-way ANOVA with Tukey post hoc test (n = 5–7). *p < 0.05, ***p < 0.001, WT ICH group versus KO ICH group. #p < 0.05, WT sham group versus KO ICH group

