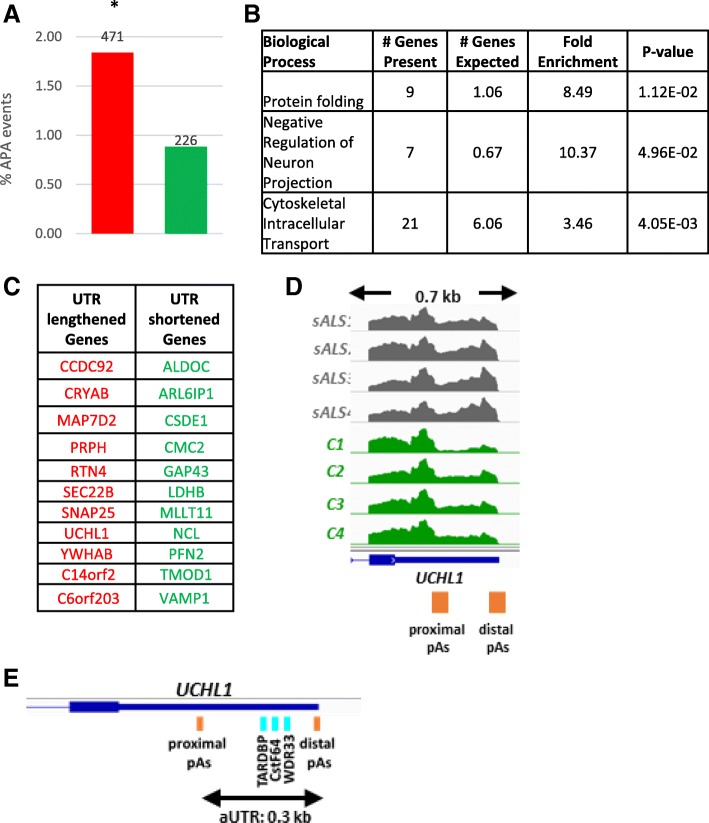
Fig. 5.
APA Regulation in Motor Neurons in sALS. a Bar chart showing the percentage of genes that showed significant UTR changes through DaPars analysis (PDUI > 0.25, Fisher’s exact test, p < 0.05). In total, 1.8% of genes showed 3’UTR lengthening (red), while fewer than 1% showed 3’UTR shortening (green) in all comparisons between 10 sALS and 8 control samples, showing a significant trend to 3’UTR lengthening (* = p < 0.05, Fisher’s exact Test). The data labels indicate number of APA events identified among all cross comparisons. b Table highlighting the biological processes that are enriched in the genes showing UTR lengthening identified with GO analysis using the PANTHER platform. The cohort of genes showing UTR shortening were not enriched in any biological processes. c Table of 22 genes showing 3’UTR lengthening or shortening events and occur in at least 3 different sALS vs control comparisons. d Genome browser view of the 3’UTR lengthening seen in UCHL1 gene in sALS (grey tracks) compared to control (green tracks). The proximal and distal poly(A) sites are shown as orange boxes the length of the genome browser window shown is indicated above in kilo bases (kb) between the two arrows. e Schematic indicating the position of RBPs found uniquely in the aUTR of UCHL1 are indicated by aqua boxes. The length of the alternative UTR (aUTR) is shown between the arrows below the gene structure

