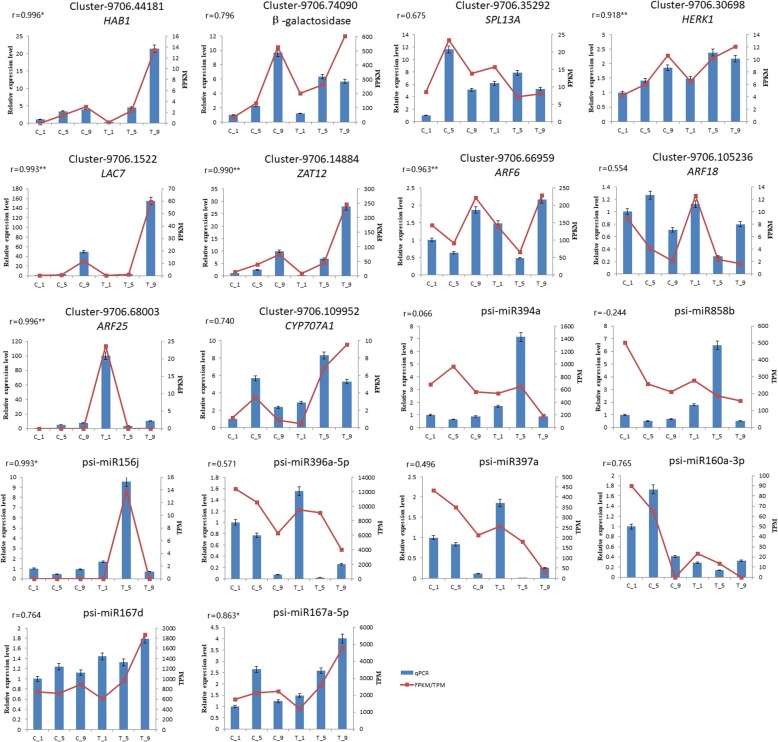
Fig. 10.
Real-time PCR validation of several DEGs and DEMs in miRNA-mRNA pairs. The x-axis represents RNA names, the left y-axis represents relative expression level, and right y-axis represents FPKM/TPM. Blue bars represent data yielded by qRT-PCR, and red points represent data obtained by RNA sequencing, ‘r’ represents Pearson correlation coefficient, *: correlation is significant at 0.05 level. **: correlation is significant at 0.01 level

