Fig. 2.
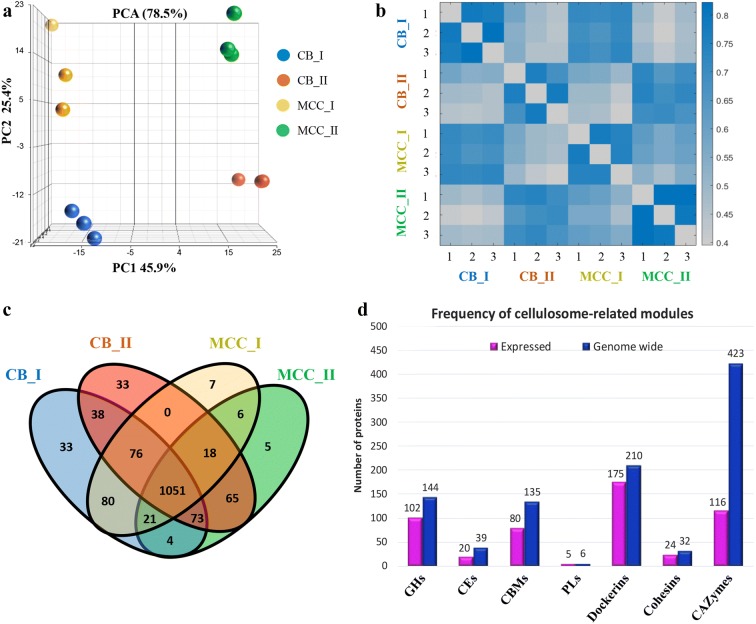
Proteomic profiling of the cellulosomal fractions. a Principal component analysis (PCA), for estimating the variance between all samples, showed a separation between the protein expression profiles of the two peak fractions (I or II), and also between proteins originating from cells grown on either MCC (microcrystalline cellulose) or CB (cellobiose). The PC1 axis is the first principal direction, along which the samples show the largest variation, and the PC2 axis is the second principle component. Percentage of the variance contributed by each principal component is indicated in the axis. b Pearson correlation coefficients for each pairwise combinations of samples (calculated from log2 LFQ values). High correlation was detected within the replicates (1–3) and also within replicates of the same peak (I or II). c Venn diagram depicting the overlap in the number of proteins, which were detected in replicates of the samples and/or between the different carbon sources. d Number of proteins containing CAZy- and cellulosome-related modules, which were detected among the 1510 proteins identified in this study (detectable in the secretome, not necessarily differentially expressed above a certain threshold). Magenta—proteins detected in this study, blue—proteins coded in the genome. Most of the cellulosomal modules are expressed. Full list of protein names and intensities is given in Additional file 1: Table S1

