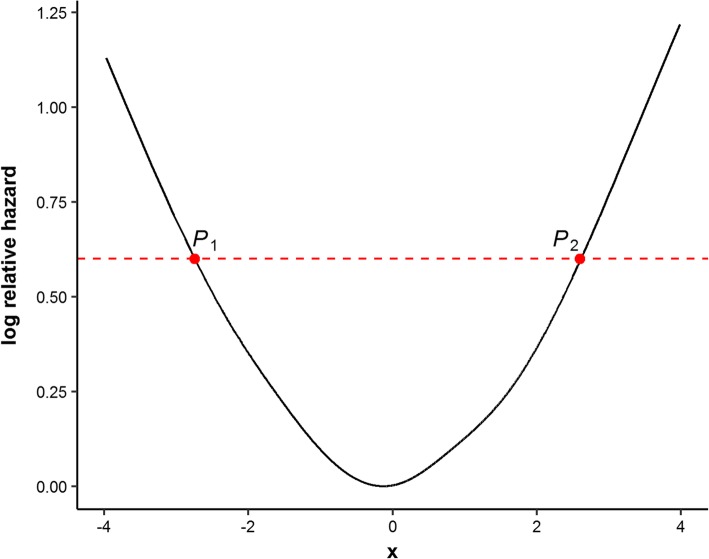
Fig. 1.
Schematic diagram of the optimal equal-HR method. The solid black line presents the U-shaped relationship between the continuous x and log relative hazard. The red dashed line is parallel to the x-axis, which means P1 and P2 have equal log relative hazard values. The optimal equal-HR method searches pairs of cut-points with equal log relative hazard values as candidate cut-points, such as (P1, P2)

