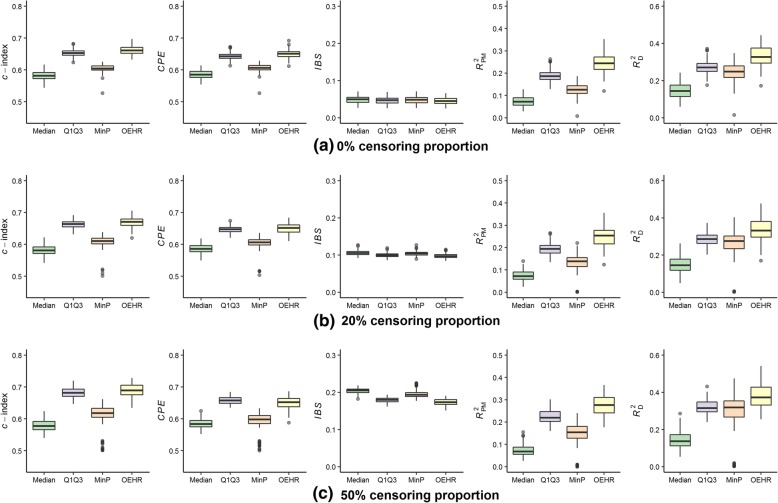
Fig. 4.
Predictive performance of estimated cut-points when (k1, k2, a) equals (− 8/5, 8/3, 1/2). a Simulation results when Pc = 0%; (b) Simulation results when Pc = 20%; (c) Simulation results when Pc = 50%. Four discretization methods are used to find optimal cut-points of simulated continuous variables. The continuous variables are transformed into categorical variables and then fitted in univariate Cox models. The boxplots present predictive performance of Cox models in term of c-index, CPE, IBS, RPM2 and RD2

