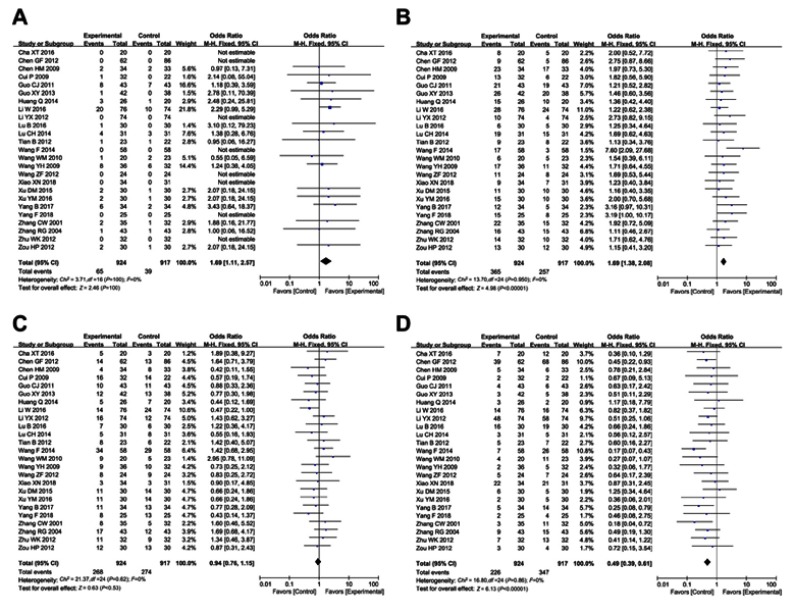
Figure S1.
Forest plot of the comparison of complete response rates (CR, A), partial response rates (PR, B), stable disease rates (SD, C) and progressive disease rates (PD, D) between the experimental and control group. Control group, chemotherapy alone group; Experimental group, chemotherapy and cinobufotalin combined group. The fixed-effects meta-analysis model (Mantel–Haenszel method) was used.

