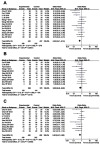
Figure S2.

Forest plot of the comparison of adverse effects including nausea and vomiting (A), diarrhea (B), leukopenia (C), thrombocytopenia (D), hepatotoxicity (E), nephrotoxicity (F), oral mucositis (G), alopecia (H), hand-foot syndrome (I), anemia (J), gastrointestinal adverse effects (K), peripheral neurotoxicity (L), neutropenia (M) and myelosuppression (N) between the experimental and control group. Control group, chemotherapy alone group; Experimental group, chemotherapy and cinobufotalin combined group.
