Figure 6.
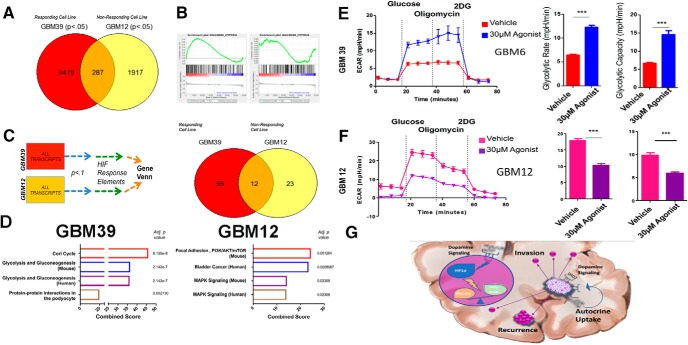
DRD2 triggers alterations in gene expression and metabolic phenotype. A, Microarray analysis of gene expression was performed in PDX cells treated with DRD2 agonist after 4 d. GeneVenn analysis was performed on gene transcripts found to be significantly elevated in the two cell lines, revealing subtype-specific alterations in expression profiles. B, GSEA was performed on each cell line for canonical hypoxia response signaling. C, D, Microarray results were then limited to genes with confirmed hypoxia response elements. E, F, Seahorse analysis was performed to quantify the glycolytic rate in two PDX lines; (E) GBM39, which responds to DRD2 activation with increased sphere-formation, and (F) GBM12, which are unresponsive to DRD2 activation in neurosphere formation. Cells were treated with either DMSO or 30 nm DRD2 agonist and subjected to Seahorse analysis after 96 h. Figure 6-1 includes a responding PDX line, GBM5, as an assay control demonstrating similar effects. Figure 6-1 also includes FACS analysis of glucose uptake and fatty acid uptake in GBM12 and 39 as further validation of seahorse assays. G, Summary schematic of dopamine's role within the tumor microenvironment and at the single-cell level. Microarray was performed on biological triplicates. Bars represent means from three independent experiments and error bars represent SD. Student t tests were performed for each separate cell line. ***p < 0.001.

