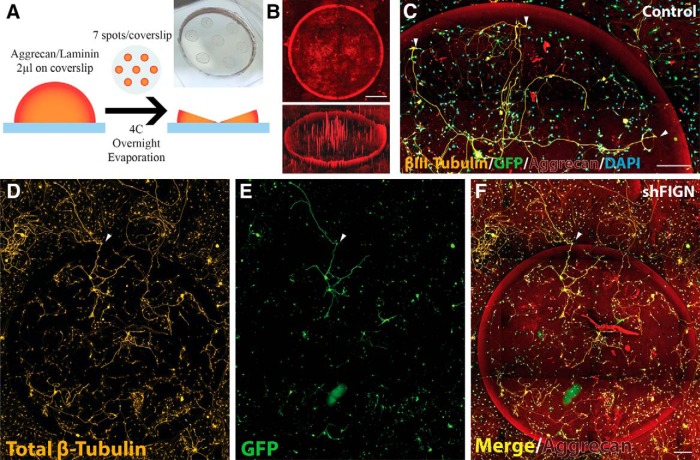
Figure 1.
Aggrecan/laminin spot assay. A, The assay uses 7 spots of 2 μl 0.7 mg/ml aggrecan and 5 μg/ml laminin solution pipetted onto the surface of glass-bottomed dishes. The spots are dried overnight to produce a “coffee ring” effect that is visible to the eye. B, The dry aggrecan spots have a high concentration of aggrecan at the edge of the spot and a gradually lower concentration moving toward the center, as can be visualized with fluorescence microscopy using an anti-aggrecan primary antibody and a Cy5 secondary antibody. The entire 20-mm-diameter insert of the glass-bottomed dishes was imaged. Shown here is a single spot with a diameter of ∼2000 μm (top) and the same image using Carl Zeiss Zen 2.5D fluorescence intensity mapping, which reveals the “half-pipe” gradient of aggrecan at the spots edge. Scale bar, 500 μm. C, The aggrecan spots are inhibitory to axonal growth, as revealed by the βIII-tubulin/GFP double-labeled neuron at the center of the spot, extending growth cones outward. White arrows indicate the point at which the dystrophic growth cones stop as they approach the dense gradient of aggrecan. DAPI staining reveals there are other, non-neuronal cells on the aggrecan spot as well. Scale bar, 200 μm. D, With a general β-tubulin antibody, all of the cells that are on the aggrecan spots are stained, including satellite glia. E, Neurons are strongly GFP+, whereas satellite glia and other non-neuronal cells are less so. F, A merged image demonstrates information available, such as the number of neurons extending axons per spot, the number of satellite glia, and the small number of axons crossing (white arrowhead). Scale bar, 200 μm.

