Figure 3.
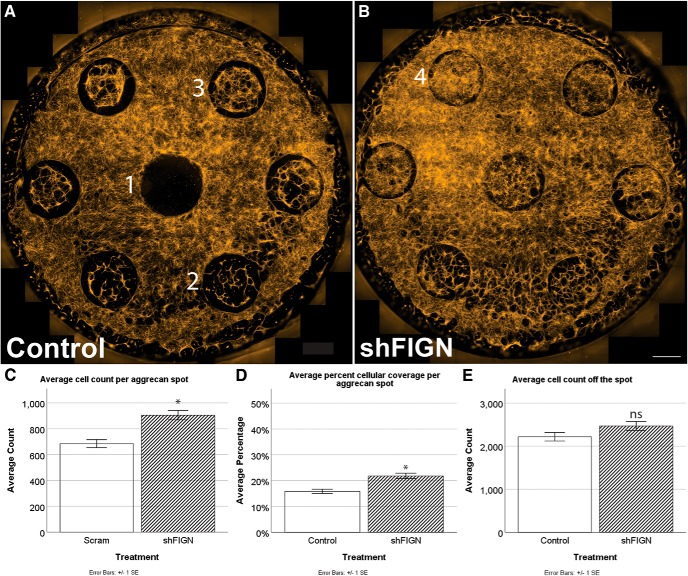
Satellite glia grow more avidly on aggrecan spots after fidgetin knockdown. A, B, Control and shFIGN-treated dishes differed in average cellular spot coverage. The aggrecan spots had minimal (1), sparse (2), or moderate (3) cellular coverage. Strong (5) cellular spot coverage was observed in the shFIGN AAV5 treatment dishes. Scale bar, 1000 μm. C, The number of DAPI+ nuclei were counted per aggrecan spot, and the number of spots increased with fidgetin knockdown: *p < 0.001. D, Total β-tubulin was immunolabeled, and ROIs were drawn around each aggrecan spot to measure the average area covered with tubulin fluorescence. The shFIGN AAV5 resulted in more aggrecan spot coverage of tubulin: *p < 0.001. E, The same ROIs were shifted to areas off the spot, and there was no significant difference in cell counts between groups.

