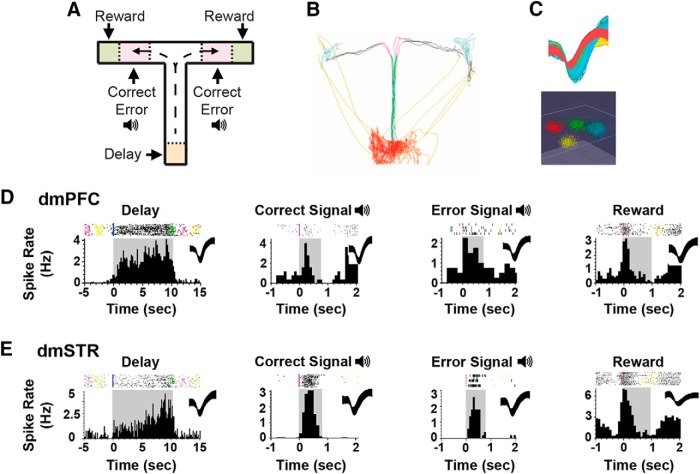
Figure 4.
Frontostriatal recordings in working memory-tested rats. A, T-maze schematic illustrating task events, including delay, two distinct auditory tones serving as outcome-related signals on correct versus error trials, and sugar reward. B, Animal position is tracked using video recordings and infrared beams. C, Top, Action potential waveforms of 4 discriminated WS dmPFC neurons. Bottom, Waveforms from these units exhibit separable clusters in 3D-principal component space. D, Exemplar rasters (top) and PETHs (bottom) of WS dmPFC neurons exhibiting punctate excitatory responses during T-maze events. Shaded areas of PETHs represent duration of interval. Spiking rates were calculated for 100 ms time bins. E, Exemplar rasters and PETHs of putative MSNs within the dmSTR displaying strong task tuning.

