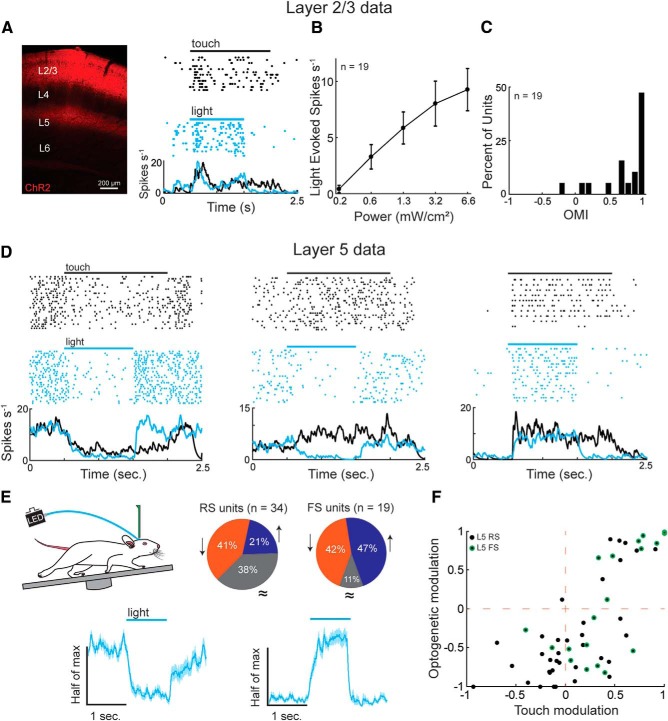
Figure 1.
Optogenetic activation of L2/3 predominantly suppresses L5. A, A histological transverse section through the barrel cortex showing L2/3 ChR2 expression with the tdTomato fluorophore. A putative ChR2-expressing layer 2/3 RS neuron that is driven during active touch and activated by a linear ramp of blue light alone. B, ChR2 activation dose–response curve showing the relationship between peak light power and firing rate. L5 data were analyzed using 1.3 mW/cm2 power. C, OMI for the population of L2/3 RS neurons (p < 0.001, Wilcoxon signed-rank test, n = 19). D, Three example L5 RS neurons that were suppressed by touch or light (left), facilitated by touch but suppressed by light (middle), or facilitated by touch or light (right). E, Top, The percentage of L5 units that were significantly facilitated (blue), suppressed (orange), or unchanged (gray) by L2/3 activation (Wilcoxon signed-rank test, α = 0.05). Bottom, Normalized population firing rates of L5 (RS and FS) units grouped by the sign of the significant effect. Neurons suppressed by light were normalized to the baseline period (left), whereas neurons facilitated by light were normalized to the light period (right). F, Relationship between touch modulation and optogenetic modulation in L5 units (p < 0.001, R2 = 0.53, n = 55, multiple linear regression). Error bars are the standard error of the mean.

