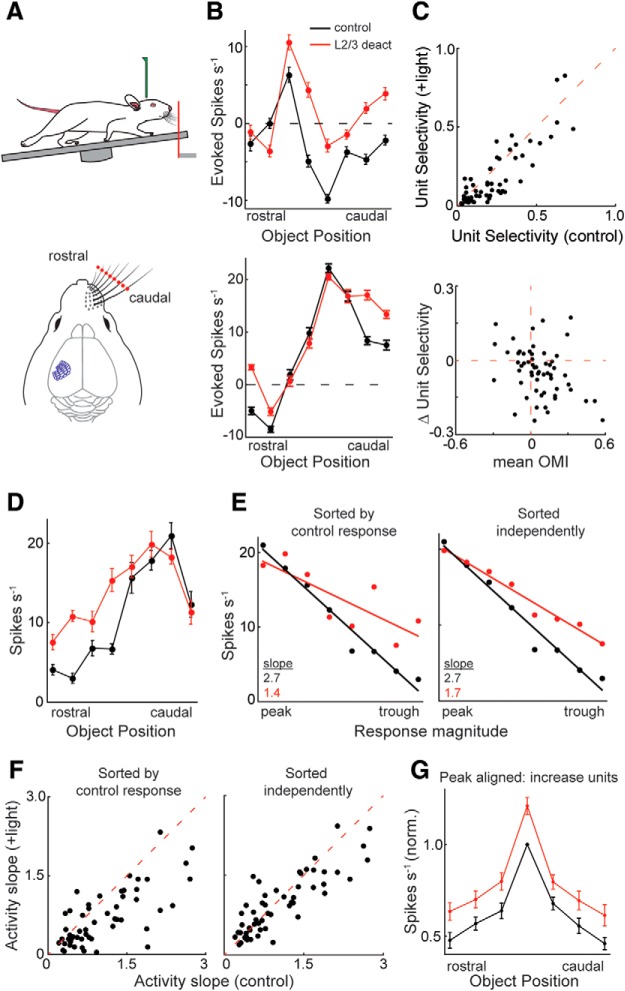
Figure 7.
L2/3 increases the selectivity and range of L5 RS receptive fields. A, Experimental set-up: head-fixed, running mice with their whisker pad intact palpated an object that was placed at eight different locations within their whisking field. B, Spatial tuning curves and rasters of two L5 RS neurons. Note the loss of touch suppression and the greater increase in spike rate in the surround regions of their receptive fields. C, Scatter plot comparing the stimulus selectivity of L5 RS units during control stimulation versus L2/3 deactivation (top, +light). L2/3 deactivation significantly reduces stimulus selectivity (p = 0.001, n = 58, Wilcoxon signed-rank test). Scatter plot of the L5 RS population comparing the mean OMI to the change in unit selectivity (bottom). D, Example L5 RS neuron with a tuning peak at the caudal region of the whisker field and a trough at the rostral region. E, The activity slopes of the example unit in D. Slopes were calculated after sorting in descending order relative to the magnitude of the control response (left) or sorting independently for both control and L2/3 deactivation conditions (right). F, Scatter plots of the L5 RS population comparing the activity slopes during control stimulation versus L2/3 deactivation. L2/3 deactivation significantly reduced the steepness of the slope (p < 0.0001: left; p = 0.02: right, Wilcoxon signed-rank test, n = 58). G, Mean ± SEM tuning curves of the population of L5 RS neurons that displayed an increase in activity during L2/3 deactivation (n = 41). Firing rates in each condition were aligned to their own peak and normalized to the largest control response. Error bars are the standard error of the mean.

