Figure 2.
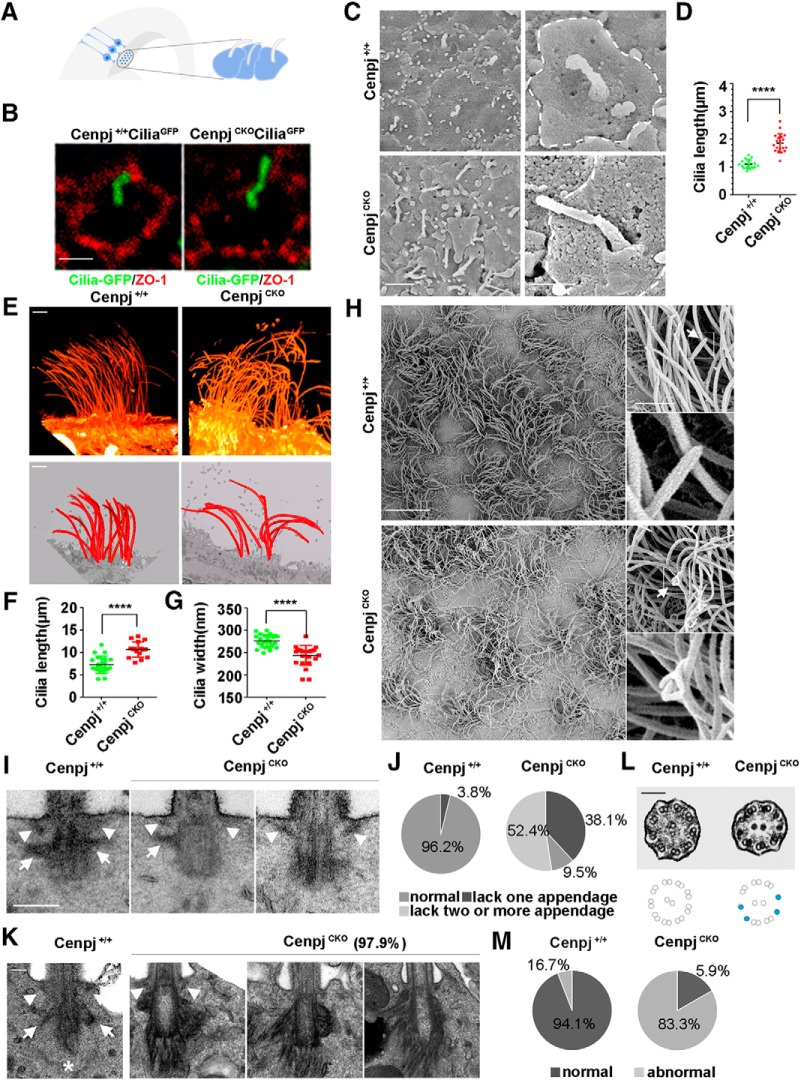
Deletion of the centrosome protein Cenpj causes overly long cilium and abnormal cilium appendages. A, Model showing the primary cilium on the end foot of RG cells on the lateral ventricle surface. B, Whole-mount immunostaining images showing that CenpjCKO cilia are longer than Cenpj+/+ cilia at E15.5. Tight junction protein ZO-1 (red) marks the cell membrane of the RG end foot. Scale bar, 1 μm. C, Scanning electron microscope images of the ventricular surface of Cenpj+/+ and CenpjCKO embryo brains at E15.5. Scale bars, 2 μm (left) and 1 μm (right). D, Quantification of the cilia length in a scatter plot showing the mean ± SD; ****p < 0.0001 as determined by a t test. E, Two ways of reconstructing SEM serial sections of the ventricular surface of Cenpj+/+ and CenpjCKO adult mouse brain. Scale bar, 2 μm. F, Quantification of the cilia length in a scatter plot showing the mean ± SD; ****p < 0.0001 as determined by a t test. G, Quantification of the cilia width in a scatter plot showing the mean ± SD; ****p < 0.0001 as determined by a t test. H, SEM images of the Cenpj+/+ and CenpjCKO adult brain ventricular surface. The motile cilia are magnified. Arrow shows the cilia tip. Scale bars, 10 μm (left and right top) and 1 μm (right bottom). I, Transmission electron microscope images of Cenpj+/+ and CenpjCKO cilium appendages of RG at E15.5. Distal appendages (arrowhead) and subdistal appendages (arrow) in Cenpj+/+ and CenpjCKO BBs. Scale bar, 250 nm. J, Percentages of normal and abnormal cilium in Cenpj+/+ and CenpjCKO mouse embryo RG cells. K, Transmission electron microscope images of Cenpj+/+ and CenpjCKO adult cilia appendages. Normal distal appendages (arrowhead) and subdistal appendages (arrow) in Cenpj+/+ cilia. Asterisk shows striated rootlets. Scale bar, 100 nm. L, Transmission electron microscope images of Cenpj+/+ and CenpjCKO adult cilia microtubule arrangement. The CenpjCKO mouse displays disorganized microtubule doublets (blue dots). Scale bar, 100 nm. M, Quantification of the percentages of normal and abnormal Cenpj+/+ or CenpjCKO adult cilia microtubule arrangement.

