Figure 5.
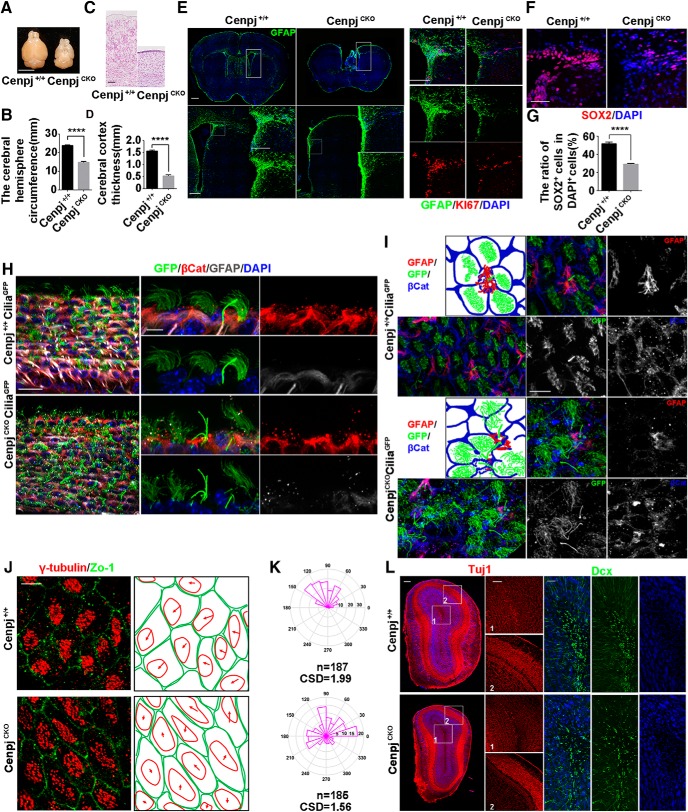
Cenpj knock-out results in defective brains in adult mice. A, Representative images of the Cenpj+/+ and CenpjCKO brain size at adult. CenpjCKO mice show severe microcephaly. Scale bar, 5 mm. B, Quantification of the mouse cerebral hemisphere circumference, Histogram shows the mean ± SD; ****p < 0.0001 as determined by a t test; n = 3. C, Representative images of Cenpj+/+ and CenpjCKO brain cortical column at 2 months by Nissl staining. Right panel shows the magnified images. Scale bar, 100 μm. D, Histogram of the cortical thickness between the Cenpj+/+ and CenpjCKO adult cerebral cortex. Data are shown as the means ± SD; ****p < 0.0001 as determined by a t test; n = 3; 3 brains per experiment. E, Representative images of Cenpj+/+ and CenpjCKO brain slices stained with GFAP (green). Right, Magnified lateral ventricles stained with GFAP (green) and Ki67 (red). Scale bars, 500 μm (left top) and 200 μm (left bottom and right). F, Representative images of Cenpj+/+ and CenpjCKO brain slices stained with Sox2 (red). Scale bars, 60 μm. G, Quantification of Sox2+ cell ratios in the VZ/SVZ. Histogram shows the mean ± SD; ****p < 0.0001 as determined by t test; n = 3; 3 brain slices per experiment. H, Whole-mount ventricles of Cenpj+/+ and CenpjCKO brains at P40, which were stained with antibodies against GFAP (gray) and β-catenin (red) in the Cenpj+/+CiliaGFP and CenpjCKO CiliaGFP mouse VZ/SVZ. Scale bar, 30 μm (left) and 10 μm (right). I, En face views of the adult SVZ pinwheel structure in Cenpj+/+CiliaGFP and CenpjCKOCiliaGFP brains at P40. Scale bar, 60 μm. J, BB polarization in ependymal multiciliated cells. Left, Tissue polarization in the Cenpj+/+ and CenpjCKO mice. Right, Algorithm for quantification of translational polarity. Scale bar, 10 μm. K, Quantification of BB translational polarity. The angles for BBOVs were calculated and angular histogram plots are shown (on average 20 cells per field of view were analyzed). p < 0.0001 as determined by an unpaired Mann–Whitney test. L, Representative images of Cenpj+/+ and CenpjCKO olfactory bulb coronal sections stained with antibodies specific to Tuj1 (red) and Dcx (green). Right panels show the magnified images. Scale bars, 200 μm (left) and 100 μm (right).

