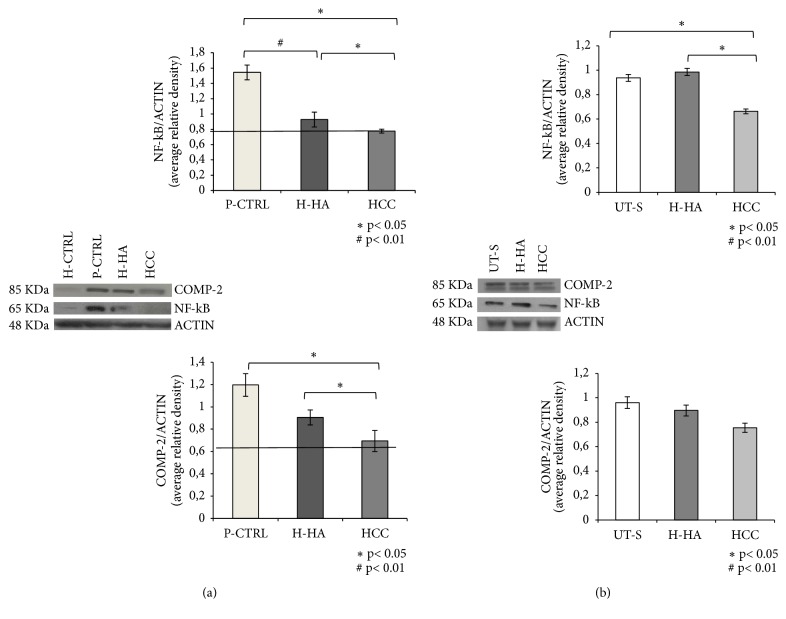
Figure 4.
WB analysis of NF-kB and COMP-2 protein levels in chondrocytes (a) and synoviocytes. (b) Densitometric analysis of specifics bands obtained for NF-kB and COMP-2 expression has been normalized with respect to actin expression. Data shown are an average of two different western blotting with two densitometric recording each, reported as mean values ± SD. (a) Significant differences between H-HA and HCC versus P-CTRL and H-HA versus HCC are indicated with asterisks ∗p<0.05, #p<0.01. Data shown are means ± SD. (b) Significant differences between H-HA and HCC versus P-CTRL and H-HA versus HCC are indicated with asterisks ∗p<0.05, #p<0.01.

