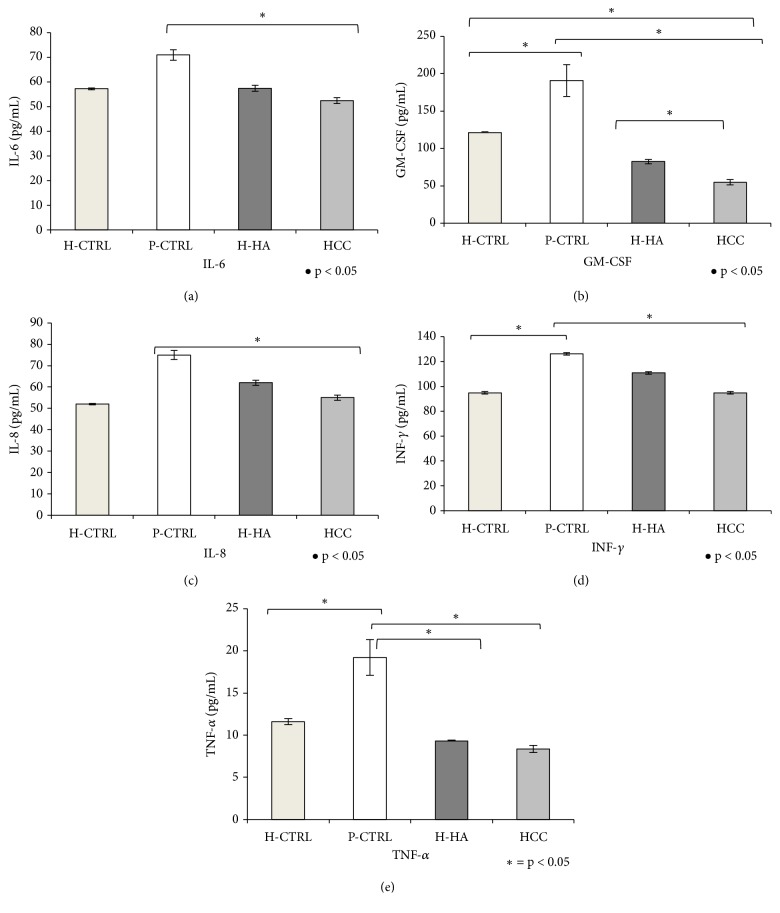
Figure 5.
Analysis of IL-6, GM-CSF, IL-8, INF-γ, and TNF-α levels in supernatants (pg/mL) by the Bio-Plex cytokines assay of chondrocytes treated for 48 h with H-HA or HCC 0.32% w/v with respect to H-CTRL and P-CTRL. Data shown are means ± SD. Significant differences between H-HA and HCC versus P-CTRL, H-HA versus HCC, and H-HA or HCC versus H-CTRL are indicated with asterisks ∗p<0.05, #p<0.01.

