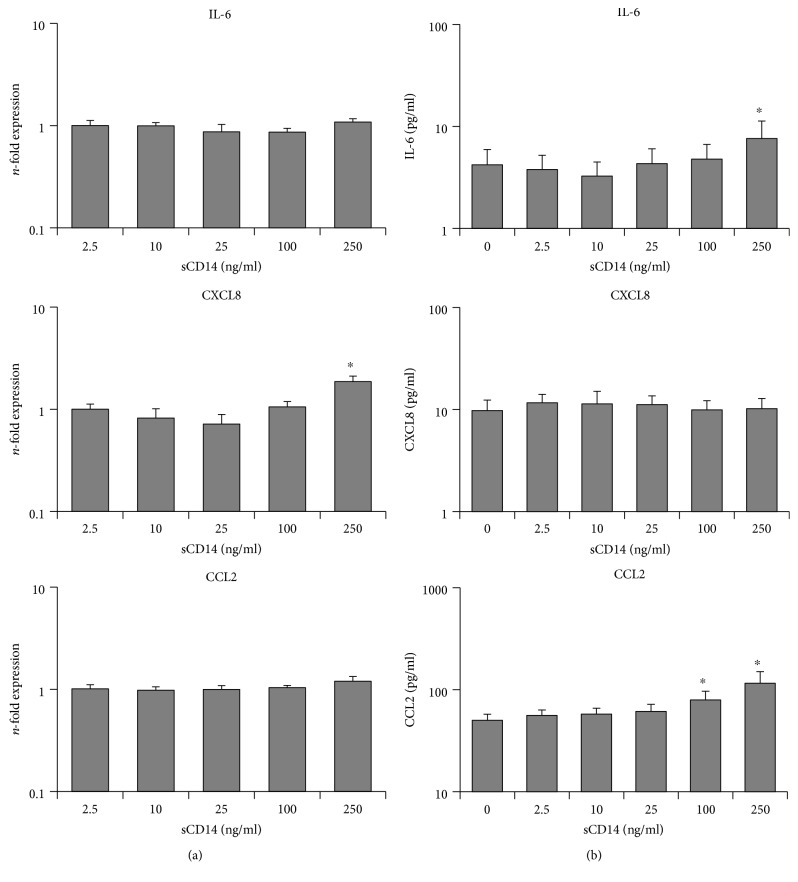
Figure 5.
Response of hPDLSCs to different sCD14 concentrations. Primary hPDLSCs were stimulated for 24 hours with different sCD14 concentrations (2.5 ng/ml–250 ng/ml) in the absence of TLR-2 agonists. Untreated cells served as the control. After 24 hours of incubation, IL-6, CXCL8, and CCL2 gene expression levels (a) were measured using qPCR. The y-axis shows the n-fold expression of the target genes compared to the unstimulated control. The corresponding protein levels in conditioned media (b) were determined by ELISA. All data are presented as mean ± s.e.m. from five independent experiments using cells from five different donors. ∗p value < 0.05 compared to the control.

