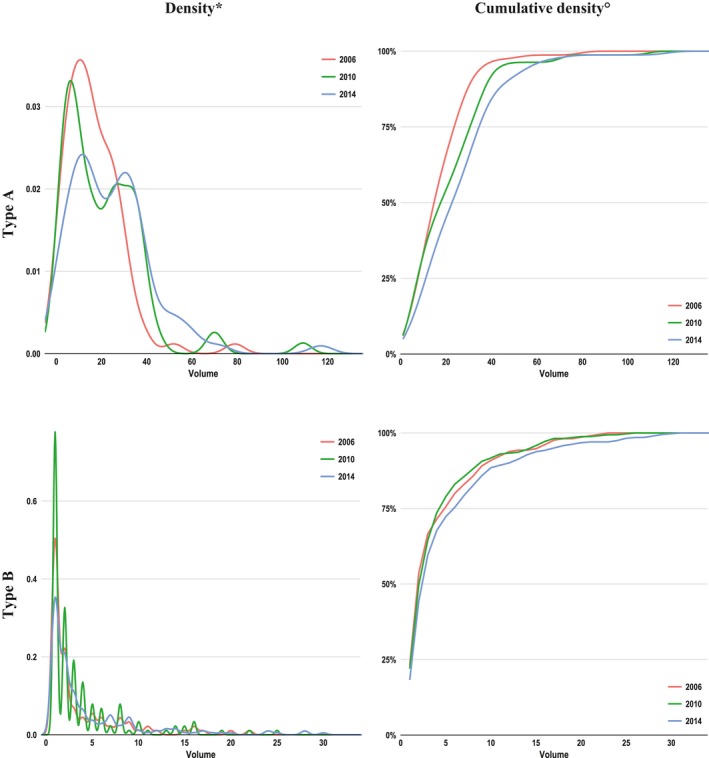
Figure 8.

Distribution of hospital annual case volumes from 2006 (red), 2010 (green), and 2014 (blue). *As histograms giving absolute number of hospitals by volume were prohibited because of the data protection law, kernel‐density plots were used for approximation. °Cumulative density indicates the share of hospitals having an annual case volume equal to or less than indicated on the x axis. For example, in 2006, ≈65% of hospitals operated on ≤20 type A aortic dissection cases, whereas in 2014, this share decreased to 44%.
