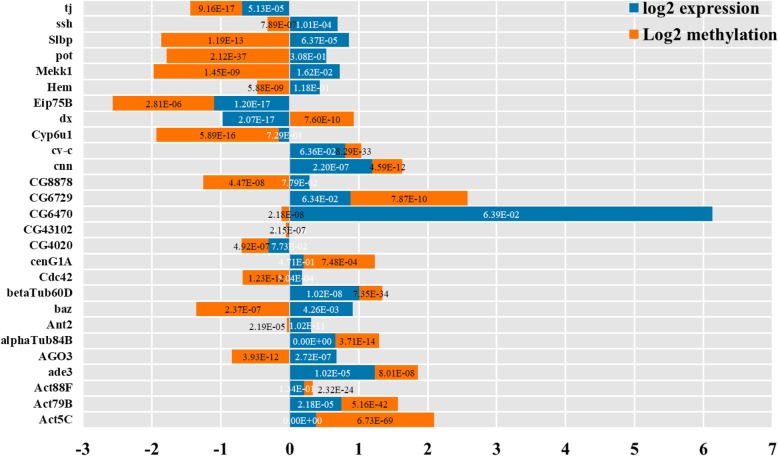
Fig. 10.
Methylation and expression levels of 27 candidate genes that are critical for the response to Cd stress. Changes in methylation (orange bars) and expression (blue bars) are shown. Values were calculated for the Cd treatment vs. the control group. The depth of methylation and transcripts per million were used in the calculation and log2 analysis was used to standardize the data. Values less and greater than zero represent down- and upregulated genes, respectively. P values are shown for each fold change; those in white and black fonts were calculated based on methylation and expression fold change, respectively

