Fig. 5.

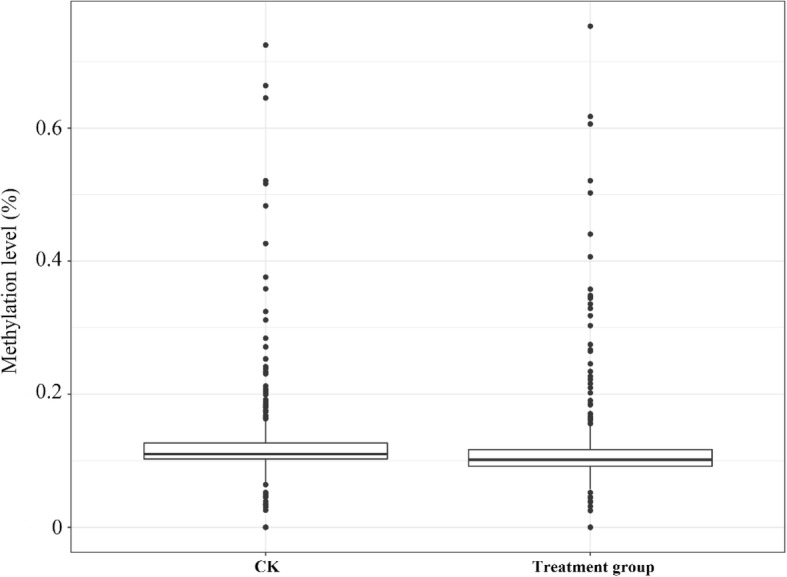
Methylation levels of DMRs in the Cd treatment and control groups. The box plot shows 25–75% quartiles; the black line in the box represents the median distribution (50% quartile)

Methylation levels of DMRs in the Cd treatment and control groups. The box plot shows 25–75% quartiles; the black line in the box represents the median distribution (50% quartile)