Figure 3.

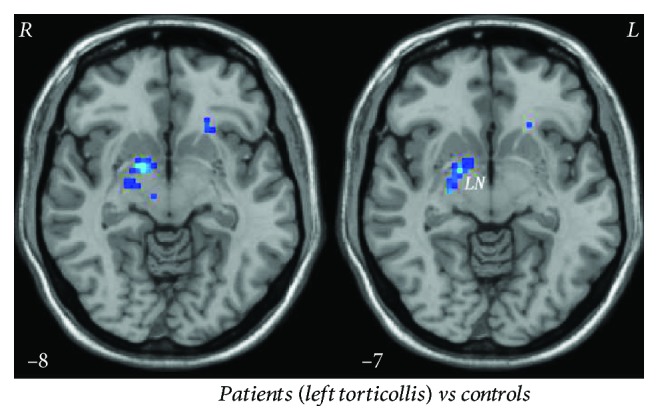
Significant degree centrality differences in the right lentiform nucleus between patients with the left torticollis and controls. Blue denotes lower degree centrality values.

Significant degree centrality differences in the right lentiform nucleus between patients with the left torticollis and controls. Blue denotes lower degree centrality values.