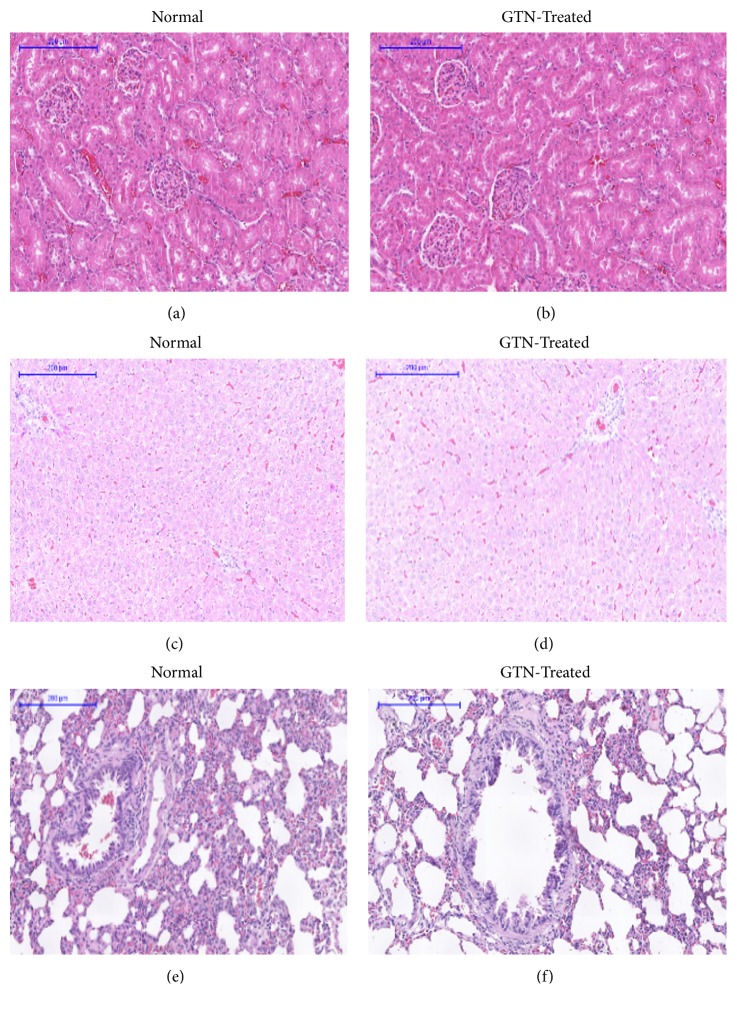
Figure 7.
Histological sections of kidney, liver, and lung of rats in subacute toxicity. (a), (c), and (e) represent histological sections of kidney, liver, and lung of the rats in the normal control group, respectively. (b), (d), and (f) represent histological sections of kidney, liver, and lung of the rats intraperitoneally treated with 42 mg/kg of GTN, respectively (100×, H&E stained).

