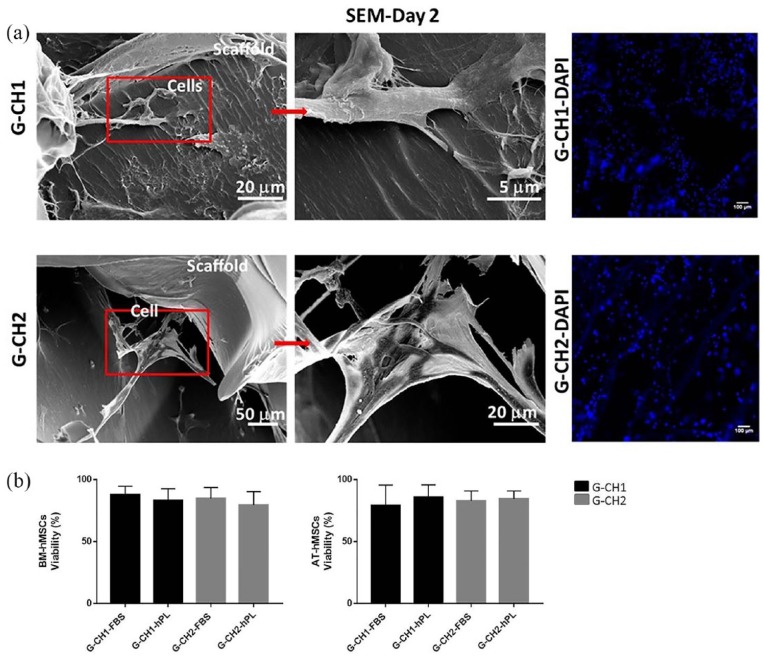
Figure 2.
(a) SEM micrographs of scaffold-cells constructs at 2 days culture show morphology and adhesion of BM-hMSCs in G-CH1 scaffold and G-CH2 scaffold. SEM images are related to the midline cross sections of the scaffolds. Scale bars: 5 µm, 20 µm, and 50 µm. Corresponding staining of nuclei (DAPI) in G-CH1 scaffold (G-CH1-DAPI) and G-CH2 scaffold (G-CH2-DAP). Scale bar: 100 µm. (b) Percentage of BM-hMSCs and AT-hMSCs viable cells cultivated for 21 days in G-CH1 and G-CH2 hydrogels in the complete medium FBS or complete medium hPL examined by live/dead staining in three replicates.

