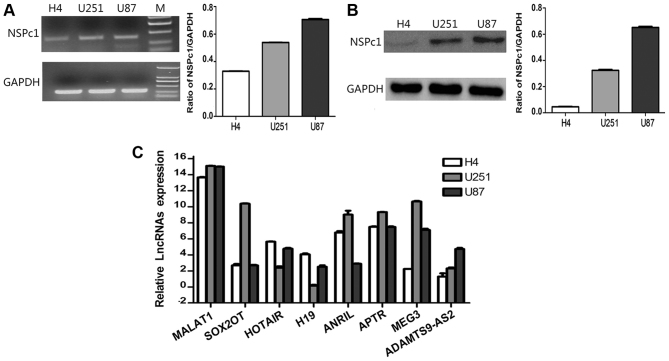
Figure 1.
Expression levels of NSPc1 and lncRNAs in H4, U251 and U87 glioma cell lines. (A) mRNA expression levels of NSPc1 as detected by RT-qPCR in glioma cells normalized to GAPDH and quantified using the 2−ΔΔCq method (right panel). RT-qPCR products were also removed for electrophoresis and visualized using a UV Transilluminator (left panel). (B) Protein expression levels of NSPc1 in glioma cells as detected by western blotting with GAPDH as an internal control. (C) Expression levels of lncRNAs in the glioma cell lines. lncRNA candidates' expression analysis was performed using RT-qPCR. Expression of each lncRNA candidate was quantified using the 2−ΔΔCq method with the expression of GAPDH used as the internal control. NSPc1, nervous system polycomb-1; lncRNAs, long non-coding RNAs; RT-qPCR, reverse transcription-quantitative polymerase chain reaction; MALAT1, metastasis associated lung adenocarcinoma transcript 1; ANRIL, antisense non-coding RNA in the INK4 locus; SOX2OT, sex-determining region of the Y chromosome-box 2 overlapping transcript; HOTAIR, homeobox protein transcript antisense RNA; APTR, alu-mediated CDKN1A/P21 transcriptional regulator; MEG3, maternally expressed 3; ADAMTS9-AS2, ADAMTS9 antisense RNA 2.

