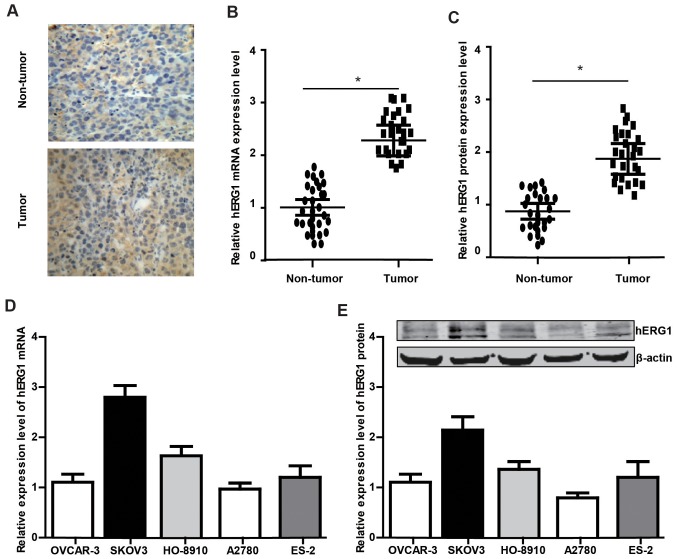
Figure 1.
Expression patterns of hERG1 in ovarian cancer tissues and cell lines. (A) Expression levels of hERG1 analyzed by immunohistochemistry (magnification, ×400). (B) Reverse transcription-quantitative polymerase chain reaction and (C) western blot analysis of hERG1 expression in ovarian cancer and matched adjacent non-tumor tissues (n=28). (D) Relative mRNA and (E) protein expression levels of hERG1 in various ovarian cancer cell lines (n=3). *P<0.05. hERG1, human ether-a-go-go-related potassium channel 1.

