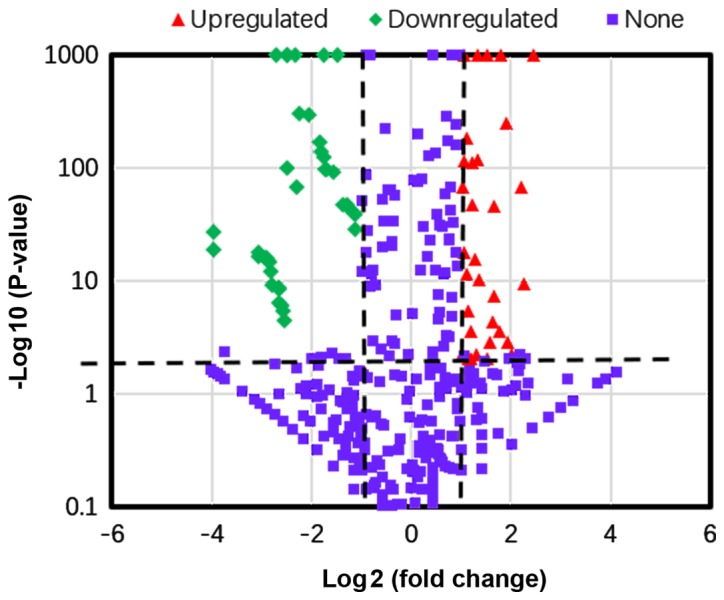
Figure 2.

Volcano plot of differentially expressed miRNAs in patients with ovarian cancer compared with healthy women. Plotted along the x-axis is the mean of log2 fold-change and the y-axis is the negative logarithm of the -log P-values. Red points represent significantly upregulated miRNAs and green points represent significantly downregulated miRNAs with a >2.0-fold change.
