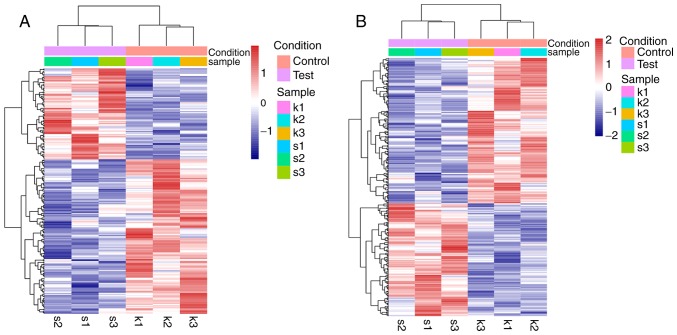
Figure 2.
Heatmap for the DEGs and DE-lncRNAs between NCI-H1299 cells in the XAV939 treatment group and in the control group. (A) A heatmap for the DE-lncRNAs. (B) A heatmap for the DEGs. s1-s3 were 3 replicate samples in the XAV939 group; k1-k3 were 3 replicate samples in the control group. Red represents the upregulated genes, while blue represents the downregulated genes. lncRNA, long non-coding RNA; DEG, differentially expressed gene.

