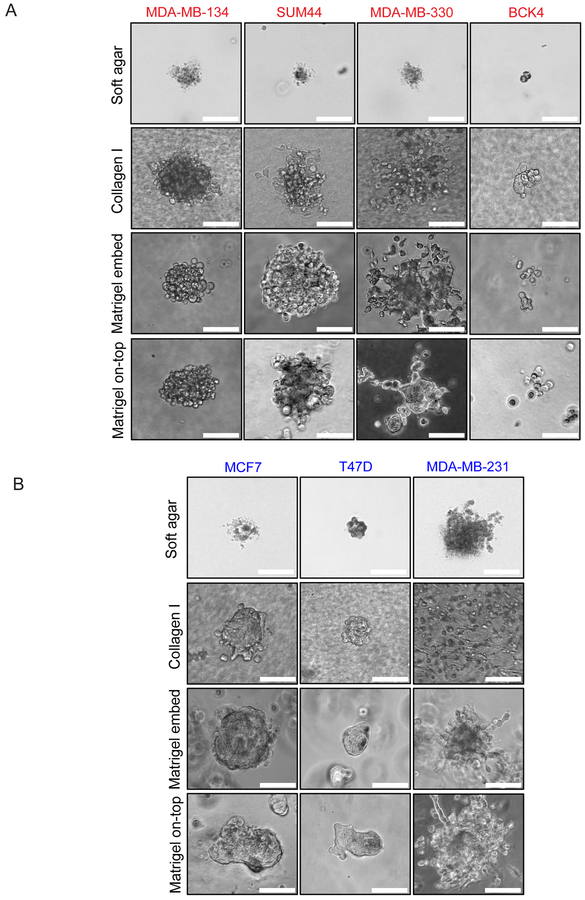
Figure 3. ILC and IDC cell lines exhibit varying morphologies in 3D culture.
Phase contrast light microscopy images of (A) ILC (red) and (B) IDC (blue) cell lines in soft agar (4 weeks post plating), Collagen I, Matrigel embedded and Matrigel on-top culture (ILC: 3 weeks post plating; IDC: 1 week post plating). Scale bar: 100 μm.

