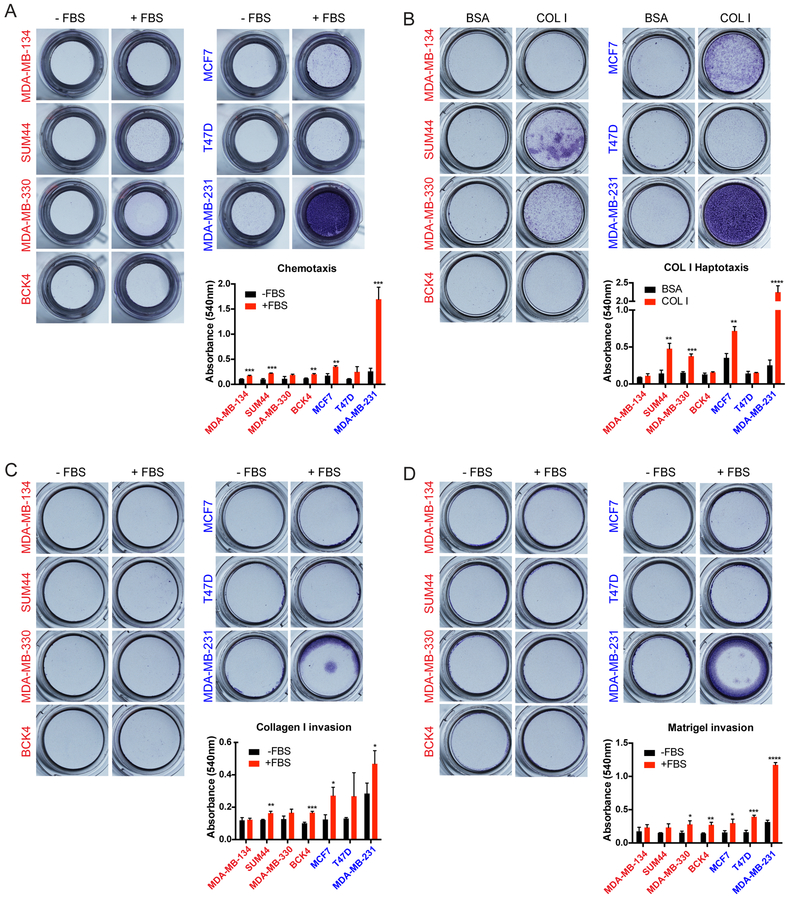
Figure 6. Human ILC cell lines exhibit limited migration and invasion towards FBS but SUM44 and MDA-MB-330 exhibit haptotaxis to Collagen I in transwell Boyden chamber assays.
A-D. Images (top) and quantification (bottom) of crystal violet-stained inserts with ILC (red; left) and IDC (blue; right) cell lines from (A) Chemotaxis (B) Haptotaxis (C) Collagen I invasion and (D) Matrigel invasion assays towards the indicated attractants after 72 hours. Graphs show representative data from two independent experiments (n=3 biological replicates). p-values are from unpaired t-test. * p ≤ 0.05; ** p ≤ 0.01; *** p ≤ 0.001; **** p ≤ 0.0001.

