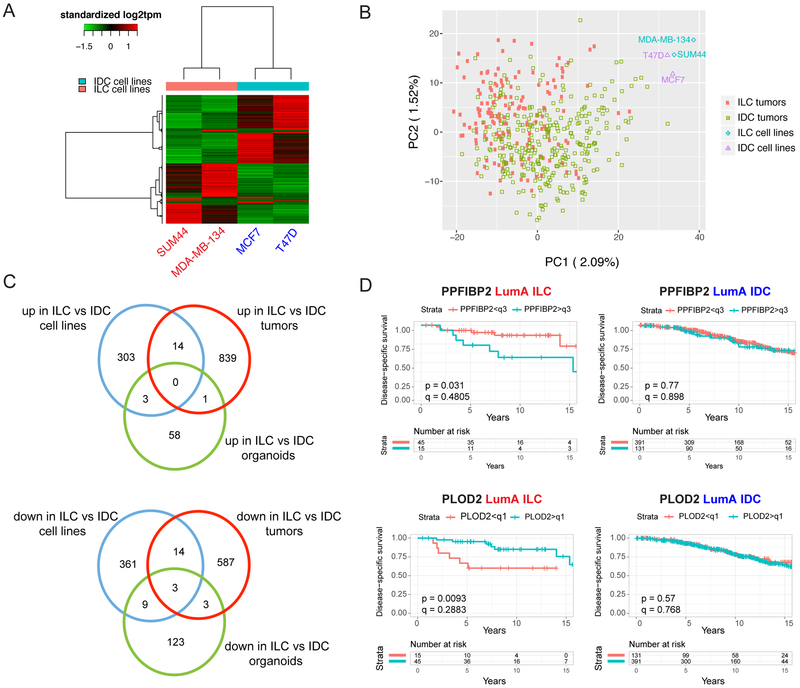
Figure 7. Transcriptional differences between human ILC and IDC cell lines and tumors.
A. Supervised clustering heat map of ILC (red) and IDC (blue) cell lines using differentially expressed genes. B. PCA clustering plot of ILC and IDC cell lines and tumors using top 1,000 differentially expressed genes. C. Venn diagrams of commonly upregulated (top) and downregulated (bottom) genes between ILC and IDC cell lines, tumors and organoids. D. Disease-specific survival curves for PPFIBP2 (top) and PLOD2 (bottom) in ER+, Luminal A ILC (red; left) and IDC (blue; right) patients in the METABRIC dataset. Patients were divided into two groups by PPFIBP2 (q3: third quadrant) and PLOD2 (q1: first quadrant) expression. p-values are from log-rank test. q-values were calculated using the Benjamini-Hochberg method to correct p-values for multiple comparisons testing within histology. The small ILC sample size (n=60) allows for limited statistical power in detecting survival differences after multiple testing correction.

