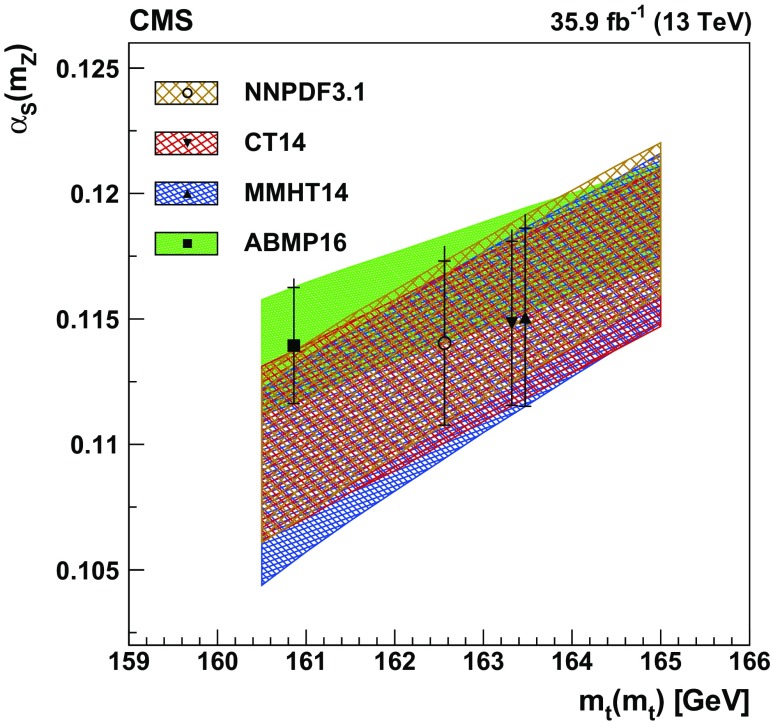
Fig. 13.
Values of obtained in the comparison of the measurement to the NNLO prediction using different PDFs, as a function of the value used in the theoretical calculation. The results from using the different PDFs are shown by the bands with different shadings, with the band width corresponding to the quadratic sum of the experimental and PDF uncertainties in . The resulting measured values of are shown by the different style points at the values used for each PDF. The inner vertical bars on the points represent the quadratic sum of the experimental and PDF uncertainties in , while the outer vertical bars show the total uncertainties

