


Figure 2. Bdnflox/lox;Emx1Cre/+ mice were resistant to diet-induced obesity.
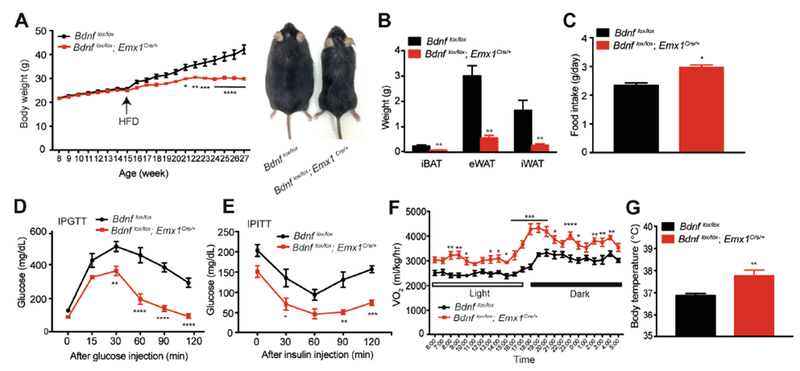
(A) Body weight (left) and representative picture (right) of control and mutant mice. Animals were fed chow diet until 15 weeks of age and then HFD for 12 weeks. N=6-9 mice per group; Two-way ANOVA followed by Bonferroni’s test: genotype, F(1,260)=139.9, p<0.0001; *p<0.05, **p<0.01, ***p<0.001 and ****p<0.0001 when comparisons were made at individual time points.
(B) Weight of individual fat tissues dissected from male mice after 12 weeks of HFD feeding. N=6-9 mice per group; **p<0.01 by Student’s t test.
(C) Daily intake of HFD. N=6-9 mice per group; **p<0.05 by Student’s t test.
(D) Intraperitoneal glucose tolerance test (IPGTT) of male mice fed HFD for 6-7 weeks. N=6-9 mice per group; Two-way ANOVA followed by Bonferroni’s test: genotype, F(1,48)=116.1, p<0.0001; **p<0.01 and ****p<0.0001 when comparisons were made at individual time points.
(E) Intraperitoneal insulin tolerance test (IPITT) of male mice fed HFD for 6-7 weeks. N=6-9 mice per group. Two-way ANOVA followed by Bonferroni’s test: genotype, F(1,40)=54.41, p<0.0001; *p<0.05, **p<0.01 and ***p<0.001 when comparisons were made at individual time points.
(F) Oxygen consumption (VO2) of male mice during the first week of HFD feeding. N=6-9 mice per group; Two-way ANOVA followed by Bonferroni’s test: genotype, F(1,312)=372.3, p<0.0001; *p<0.05, **p<0.01, ***p<0.001 and ****p<0.0001 when comparisons were made at individual time points.
(G) Core body temperature of male mice fed HFD, measured at around 4-5 pm. N=6-9 mice per group; **p<0.01 by Student’s t test.
All data are presented as mean ± SEM.