
Figure 6. Elevated anxiety levels and reduced GABAergic transmission in Bdnflox/lox;Emx1Cre/+ mice.
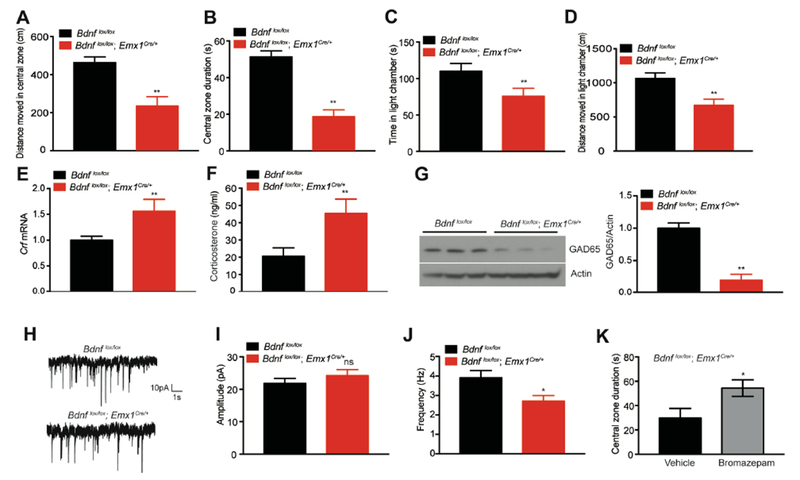
(A and B) Distance moved in central zone and time spent in central zone (central zone duration) during the first 5 minutes of open field tests. N=8-13 mice per group; **p<0.01 by Student’s t test.
(C and D) Time spent and distance moved in the light chamber during light-dark box tests. N=8-13 mice per group; **p<0.01 by Student’s t test.
(E) Gene expression of corticotropin-releasing factor (Crf) in the hypothalamus, determined by qRT-PCR. Hypothalami were dissected from mice fed HFD for 12 weeks. N=6-8 mice per group. **p<0.01 by Student’s t test.
(F) Corticosterone levels in the plasma of HFD-fed male Bdnflox/lox;Emx1Cre/+ and Bdnflox/lox mice. N=8-10 mice per group; **p<0.01 by Student’s t test.
(G) Western blotting analysis and quantification of GAD65 in the cortex. ** p<0.01 by Student’s t test.
(H) Representative traces of mIPSCs in layer 5 pyramidal neurons of the mPFC.
(I) Amplitudes of mIPSCs. N=12-14 neurons from 3 mice per group; ns, not significant by Student’s t test.
(J) Frequency of mIPSCs. N=12-14 neurons from 3 mice per group; * p<0.05 by Student’s t test.
(K) Time spent in central zone during the first 5 minutes of open field tests. Male Bdnflox/lox;Emx1Cre/+ mice were treated with vehicle or bromazepam (50 μg/kg). N=7 mice per group; *p<0.05 by Student’s t test.
All data were presented as mean ± SEM.