Figure 1.
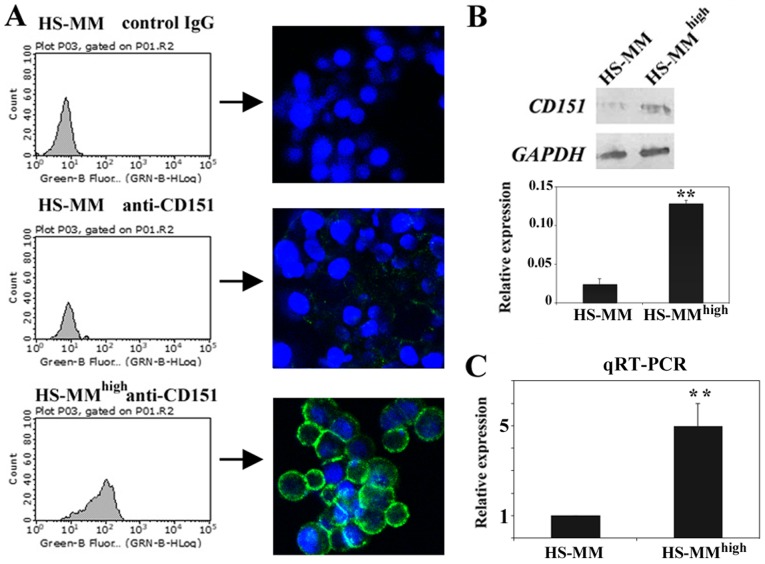
Expression of CD151 in HS-MMhigh cells correlates with metastatic activity compared to HS-MM cells. (A) Original HS-MM cells exhibited weak immunoreactivity at the cell surface with specific antibody to CD151. By contrast, the surface of HS-MMhigh cells was strongly stained with anti-CD151 antibody. Staining was analyzed using a Guava EasyCyte cell analyzer and accompanying software to obtain a one-parameter log histogram. Immunocytostaining results are also shown. CD151 immunoreactivity visualized with green-fluorescent Invitrogen Alexa Fluor 488 and blue 4′,6-diamidino-2-phenylindole nuclear counterstain. (B) Representative immunoblotting using HS-MM and HS-MMhigh cells. Immunoblotting showed that HS-MMhigh cells abundantly expressed CD151 compared to original HS-MM cells. The equal intensity of the GAPDH band indicated equal protein loading. Semiquantitation was done as described in the Methods. The intensity ratio of each band to GAPDH is shown. Data are expressed as mean ± SD (n=3; Student's t-test, **P<0.01 vs. counterpart). (C) Reverse transcription-quantitative polymerase chain reaction also demonstrated that HS-MMhigh cells expressed higher levels of CD151 mRNA than the original HS-MM cells. The value for the HS-MMhigh groups (n=3) was calculated as the fold-change relative to the mean value for the HS-MM group (control set to 1.0). Standard deviations were then computed for the triplicate sets. Student's t-test was performed to confirm the significant differences, **P<0.01 vs. counterpart. CD151, cluster of differentiation 151; SD, standard deviation.

