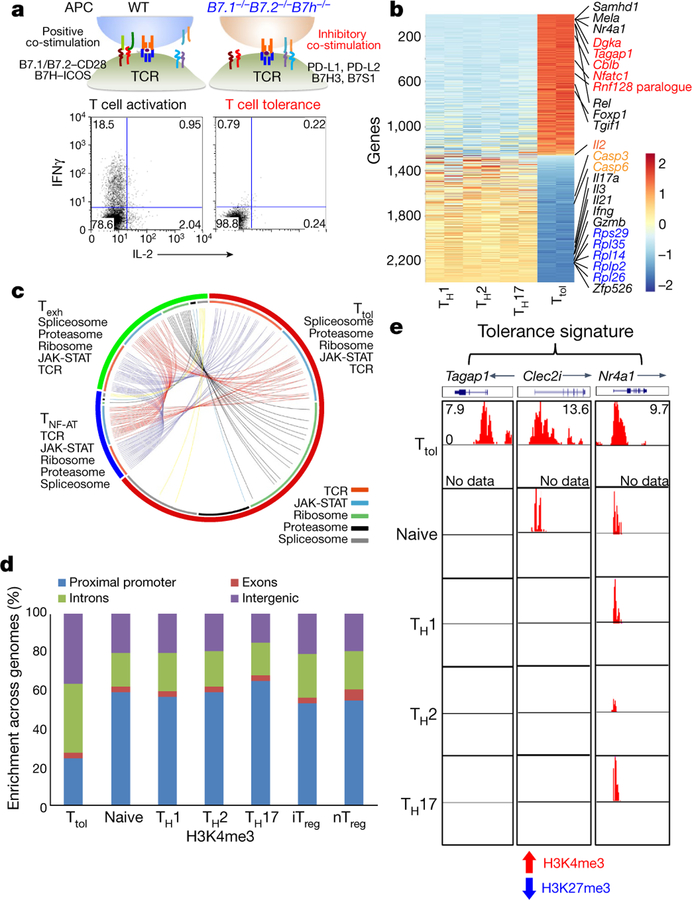
Fig. 1. Ttol cells exhibit distinct transcriptional and epigenetic features.
a, Experimental strategy for generating activated or tolerant T cells in vitro. WT, wild type. b, Heatmap of 2,357 genes for four groups of T cells (TH1, TH2, TH17 and Ttol). The colour coding indicates the expression level of 2,357 genes, with 0 as the median (gene expression level standardized by z-score). c, Circos plots showing overlapping genes in five gene modules from Ttol, TNF-AT and Texh cells. Line connections indicate shared genes between groups. d, Comparison of global distribution of H3K4me3 modifications at promoter, exon, intron and intergenic regions among Ttol, naive, TH1, T H2, TH17, iTreg and nTreg cells. e, Histone modifications of H3K4me3 and H3K27me3 in the Ttol cell-related genes Tagap1, Clec2i and Nr4a1, among Ttol, naive, TH1, TH 2 and TH17 cells. Experiments or analyses were independently repeated twice with similar results (a, d, e).

